Pueblo vs African GED/Equivalency
COMPARE
Pueblo
African
GED/Equivalency
GED/Equivalency Comparison
Pueblo
Africans
82.3%
GED/EQUIVALENCY
0.0/ 100
METRIC RATING
288th/ 347
METRIC RANK
83.4%
GED/EQUIVALENCY
0.5/ 100
METRIC RATING
256th/ 347
METRIC RANK
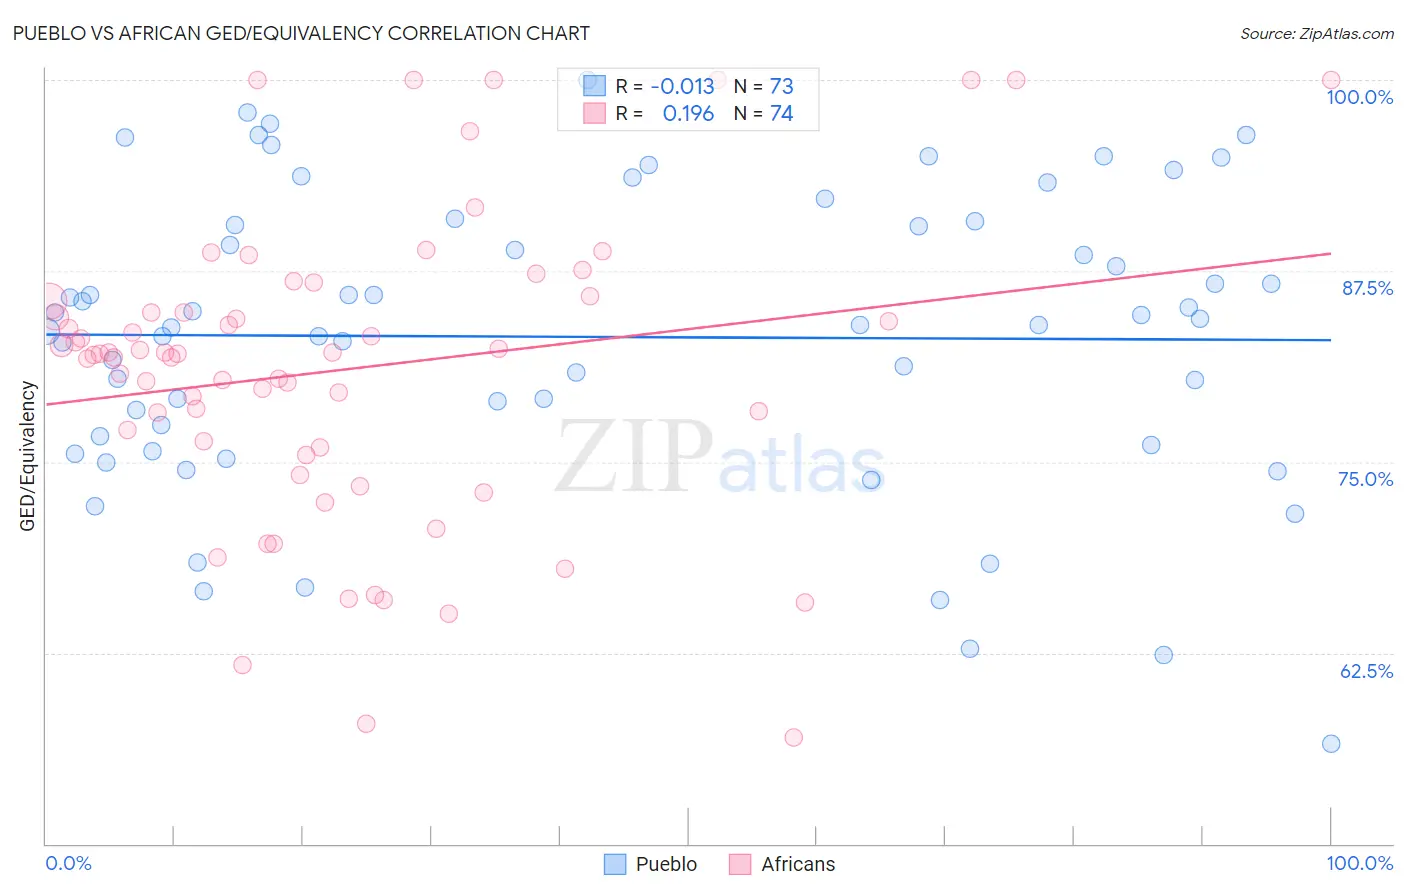
Pueblo vs African GED/Equivalency Correlation Chart
The statistical analysis conducted on geographies consisting of 120,086,468 people shows no correlation between the proportion of Pueblo and percentage of population with at least ged/equivalency education in the United States with a correlation coefficient (R) of -0.013 and weighted average of 82.3%. Similarly, the statistical analysis conducted on geographies consisting of 470,092,963 people shows a poor positive correlation between the proportion of Africans and percentage of population with at least ged/equivalency education in the United States with a correlation coefficient (R) of 0.196 and weighted average of 83.4%, a difference of 1.4%.
GED/Equivalency Correlation Summary
| Measurement | Pueblo | African |
| Minimum | 56.5% | 56.9% |
| Maximum | 100.0% | 100.0% |
| Range | 43.5% | 43.1% |
| Mean | 83.2% | 81.0% |
| Median | 84.0% | 82.1% |
| Interquartile 25% (IQ1) | 76.4% | 75.9% |
| Interquartile 75% (IQ3) | 90.6% | 85.5% |
| Interquartile Range (IQR) | 14.2% | 9.6% |
| Standard Deviation (Sample) | 9.6% | 9.9% |
| Standard Deviation (Population) | 9.6% | 9.8% |
Similar Demographics by GED/Equivalency
Demographics Similar to Pueblo by GED/Equivalency
In terms of ged/equivalency, the demographic groups most similar to Pueblo are Immigrants from Cambodia (82.2%, a difference of 0.080%), Japanese (82.4%, a difference of 0.10%), Immigrants from West Indies (82.4%, a difference of 0.12%), Cajun (82.4%, a difference of 0.14%), and Immigrants from Barbados (82.4%, a difference of 0.17%).
| Demographics | Rating | Rank | GED/Equivalency |
| Sioux | 0.1 /100 | #281 | Tragic 82.6% |
| Immigrants | Immigrants | 0.1 /100 | #282 | Tragic 82.6% |
| Indonesians | 0.1 /100 | #283 | Tragic 82.5% |
| Immigrants | Barbados | 0.1 /100 | #284 | Tragic 82.4% |
| Cajuns | 0.0 /100 | #285 | Tragic 82.4% |
| Immigrants | West Indies | 0.0 /100 | #286 | Tragic 82.4% |
| Japanese | 0.0 /100 | #287 | Tragic 82.4% |
| Pueblo | 0.0 /100 | #288 | Tragic 82.3% |
| Immigrants | Cambodia | 0.0 /100 | #289 | Tragic 82.2% |
| Haitians | 0.0 /100 | #290 | Tragic 82.1% |
| Cubans | 0.0 /100 | #291 | Tragic 82.0% |
| Paiute | 0.0 /100 | #292 | Tragic 82.0% |
| British West Indians | 0.0 /100 | #293 | Tragic 82.0% |
| Immigrants | St. Vincent and the Grenadines | 0.0 /100 | #294 | Tragic 82.0% |
| Nepalese | 0.0 /100 | #295 | Tragic 81.9% |
Demographics Similar to Africans by GED/Equivalency
In terms of ged/equivalency, the demographic groups most similar to Africans are Colville (83.4%, a difference of 0.010%), Jamaican (83.3%, a difference of 0.13%), Malaysian (83.3%, a difference of 0.16%), Creek (83.6%, a difference of 0.18%), and Comanche (83.6%, a difference of 0.20%).
| Demographics | Rating | Rank | GED/Equivalency |
| Crow | 1.1 /100 | #249 | Tragic 83.8% |
| Shoshone | 1.0 /100 | #250 | Tragic 83.7% |
| Spanish Americans | 0.8 /100 | #251 | Tragic 83.6% |
| Bahamians | 0.8 /100 | #252 | Tragic 83.6% |
| Comanche | 0.7 /100 | #253 | Tragic 83.6% |
| Creek | 0.7 /100 | #254 | Tragic 83.6% |
| Colville | 0.5 /100 | #255 | Tragic 83.4% |
| Africans | 0.5 /100 | #256 | Tragic 83.4% |
| Jamaicans | 0.4 /100 | #257 | Tragic 83.3% |
| Malaysians | 0.4 /100 | #258 | Tragic 83.3% |
| Immigrants | Vietnam | 0.3 /100 | #259 | Tragic 83.2% |
| Choctaw | 0.3 /100 | #260 | Tragic 83.1% |
| Inupiat | 0.2 /100 | #261 | Tragic 83.1% |
| Immigrants | Armenia | 0.2 /100 | #262 | Tragic 83.1% |
| Immigrants | Congo | 0.2 /100 | #263 | Tragic 83.1% |