Paraguayan vs Immigrants from Netherlands Female Unemployment
COMPARE
Paraguayan
Immigrants from Netherlands
Female Unemployment
Female Unemployment Comparison
Paraguayans
Immigrants from Netherlands
5.1%
FEMALE UNEMPLOYMENT
93.2/ 100
METRIC RATING
106th/ 347
METRIC RANK
5.0%
FEMALE UNEMPLOYMENT
97.8/ 100
METRIC RATING
78th/ 347
METRIC RANK
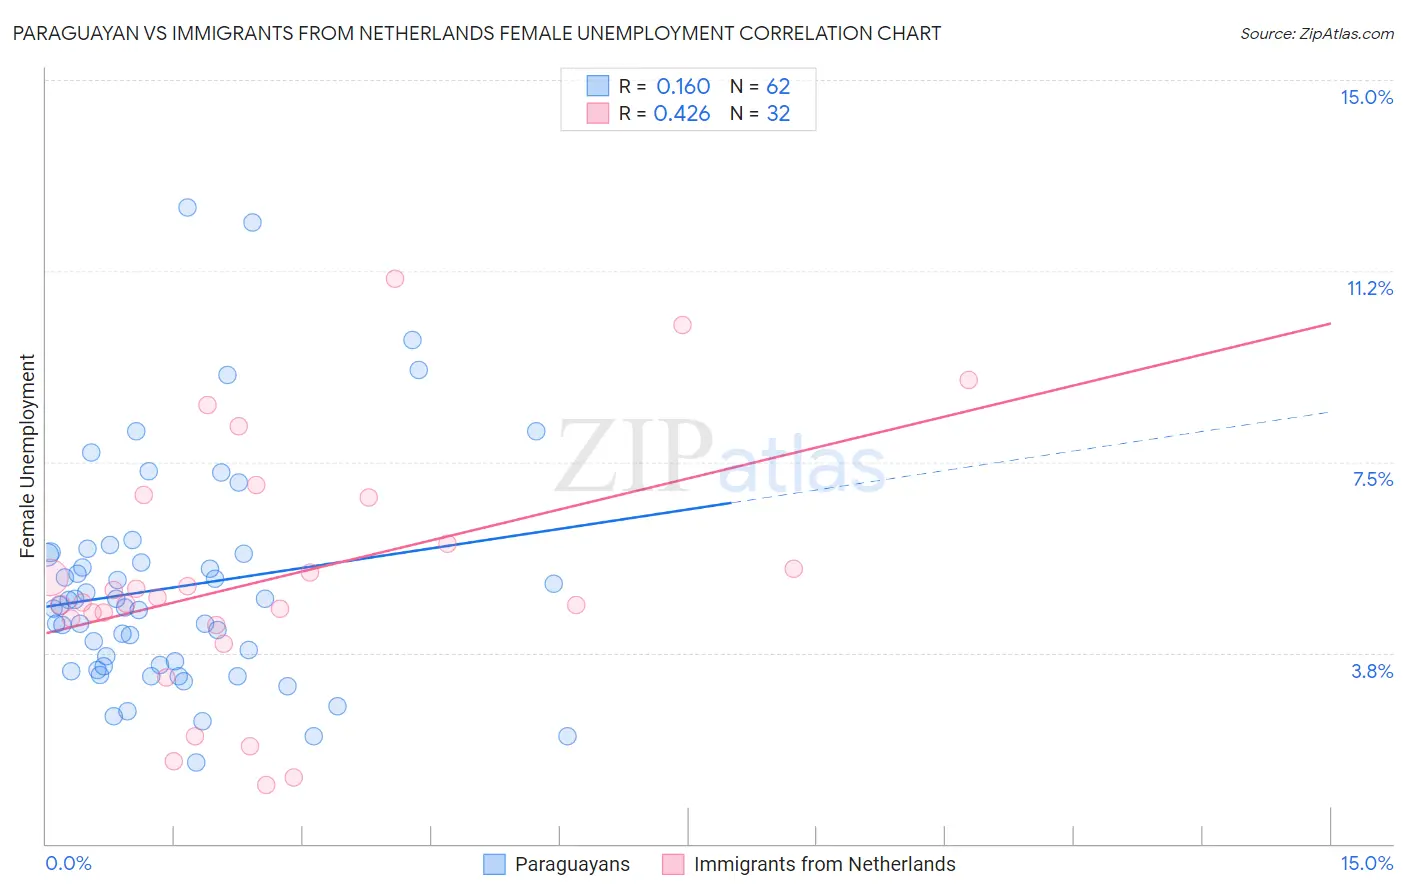
Paraguayan vs Immigrants from Netherlands Female Unemployment Correlation Chart
The statistical analysis conducted on geographies consisting of 95,037,971 people shows a poor positive correlation between the proportion of Paraguayans and unemploymnet rate among females in the United States with a correlation coefficient (R) of 0.160 and weighted average of 5.1%. Similarly, the statistical analysis conducted on geographies consisting of 237,125,714 people shows a moderate positive correlation between the proportion of Immigrants from Netherlands and unemploymnet rate among females in the United States with a correlation coefficient (R) of 0.426 and weighted average of 5.0%, a difference of 1.9%.
Female Unemployment Correlation Summary
| Measurement | Paraguayan | Immigrants from Netherlands |
| Minimum | 1.6% | 1.2% |
| Maximum | 12.5% | 11.1% |
| Range | 10.9% | 9.9% |
| Mean | 5.0% | 5.2% |
| Median | 4.7% | 4.8% |
| Interquartile 25% (IQ1) | 3.5% | 4.4% |
| Interquartile 75% (IQ3) | 5.7% | 6.4% |
| Interquartile Range (IQR) | 2.2% | 2.0% |
| Standard Deviation (Sample) | 2.2% | 2.4% |
| Standard Deviation (Population) | 2.2% | 2.4% |
Similar Demographics by Female Unemployment
Demographics Similar to Paraguayans by Female Unemployment
In terms of female unemployment, the demographic groups most similar to Paraguayans are Immigrants from Switzerland (5.1%, a difference of 0.030%), Puget Sound Salish (5.1%, a difference of 0.050%), Immigrants from England (5.0%, a difference of 0.090%), Immigrants from Eastern Africa (5.1%, a difference of 0.090%), and Kenyan (5.0%, a difference of 0.12%).
| Demographics | Rating | Rank | Female Unemployment |
| Immigrants | Zaire | 95.2 /100 | #99 | Exceptional 5.0% |
| Indonesians | 95.1 /100 | #100 | Exceptional 5.0% |
| Immigrants | Czechoslovakia | 95.0 /100 | #101 | Exceptional 5.0% |
| Immigrants | Kenya | 94.8 /100 | #102 | Exceptional 5.0% |
| Somalis | 94.6 /100 | #103 | Exceptional 5.0% |
| Kenyans | 93.7 /100 | #104 | Exceptional 5.0% |
| Immigrants | England | 93.6 /100 | #105 | Exceptional 5.0% |
| Paraguayans | 93.2 /100 | #106 | Exceptional 5.1% |
| Immigrants | Switzerland | 93.1 /100 | #107 | Exceptional 5.1% |
| Puget Sound Salish | 93.0 /100 | #108 | Exceptional 5.1% |
| Immigrants | Eastern Africa | 92.8 /100 | #109 | Exceptional 5.1% |
| Macedonians | 92.4 /100 | #110 | Exceptional 5.1% |
| Immigrants | Burma/Myanmar | 92.3 /100 | #111 | Exceptional 5.1% |
| Estonians | 92.1 /100 | #112 | Exceptional 5.1% |
| Immigrants | Saudi Arabia | 91.2 /100 | #113 | Exceptional 5.1% |
Demographics Similar to Immigrants from Netherlands by Female Unemployment
In terms of female unemployment, the demographic groups most similar to Immigrants from Netherlands are Mongolian (5.0%, a difference of 0.0%), Immigrants from Venezuela (5.0%, a difference of 0.090%), Immigrants from Singapore (5.0%, a difference of 0.10%), Immigrants from Bolivia (5.0%, a difference of 0.12%), and Russian (5.0%, a difference of 0.13%).
| Demographics | Rating | Rank | Female Unemployment |
| German Russians | 98.1 /100 | #71 | Exceptional 4.9% |
| Immigrants | Northern Europe | 98.0 /100 | #72 | Exceptional 4.9% |
| Russians | 98.0 /100 | #73 | Exceptional 5.0% |
| Immigrants | Bolivia | 98.0 /100 | #74 | Exceptional 5.0% |
| Immigrants | Singapore | 98.0 /100 | #75 | Exceptional 5.0% |
| Immigrants | Venezuela | 97.9 /100 | #76 | Exceptional 5.0% |
| Mongolians | 97.8 /100 | #77 | Exceptional 5.0% |
| Immigrants | Netherlands | 97.8 /100 | #78 | Exceptional 5.0% |
| Turks | 97.6 /100 | #79 | Exceptional 5.0% |
| New Zealanders | 97.4 /100 | #80 | Exceptional 5.0% |
| Filipinos | 97.3 /100 | #81 | Exceptional 5.0% |
| Immigrants | Australia | 97.3 /100 | #82 | Exceptional 5.0% |
| Immigrants | Serbia | 97.2 /100 | #83 | Exceptional 5.0% |
| Canadians | 97.2 /100 | #84 | Exceptional 5.0% |
| Ukrainians | 97.1 /100 | #85 | Exceptional 5.0% |