Palestinian vs Immigrants from Congo Female Poverty
COMPARE
Palestinian
Immigrants from Congo
Female Poverty
Female Poverty Comparison
Palestinians
Immigrants from Congo
12.5%
FEMALE POVERTY
94.3/ 100
METRIC RATING
104th/ 347
METRIC RANK
17.4%
FEMALE POVERTY
0.0/ 100
METRIC RATING
317th/ 347
METRIC RANK
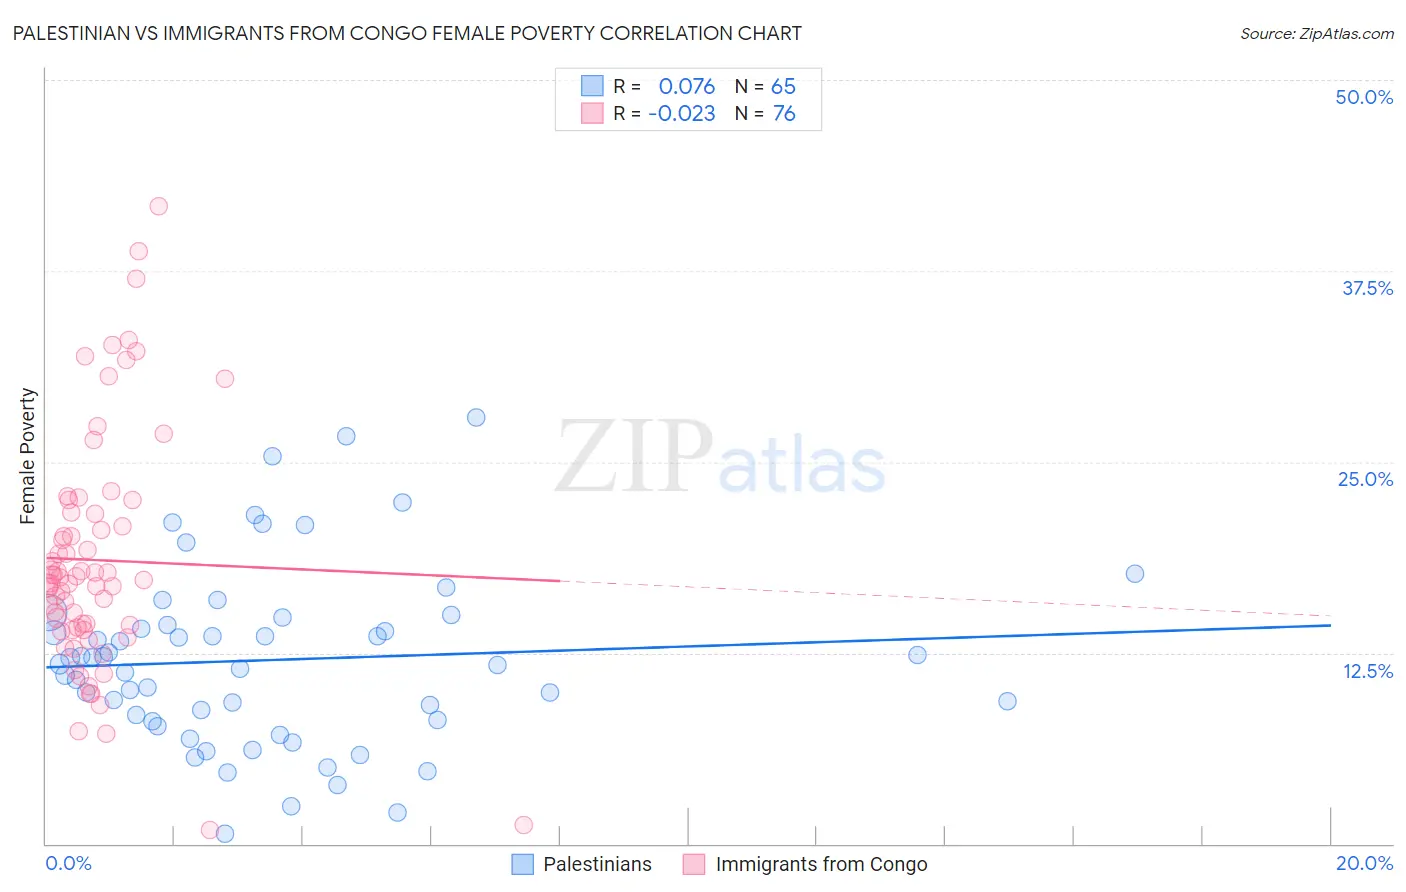
Palestinian vs Immigrants from Congo Female Poverty Correlation Chart
The statistical analysis conducted on geographies consisting of 216,371,597 people shows a slight positive correlation between the proportion of Palestinians and poverty level among females in the United States with a correlation coefficient (R) of 0.076 and weighted average of 12.5%. Similarly, the statistical analysis conducted on geographies consisting of 92,087,948 people shows no correlation between the proportion of Immigrants from Congo and poverty level among females in the United States with a correlation coefficient (R) of -0.023 and weighted average of 17.4%, a difference of 38.8%.
Female Poverty Correlation Summary
| Measurement | Palestinian | Immigrants from Congo |
| Minimum | 0.63% | 0.94% |
| Maximum | 27.9% | 41.7% |
| Range | 27.3% | 40.8% |
| Mean | 12.0% | 18.6% |
| Median | 11.8% | 17.3% |
| Interquartile 25% (IQ1) | 8.0% | 14.1% |
| Interquartile 75% (IQ3) | 14.6% | 21.6% |
| Interquartile Range (IQR) | 6.5% | 7.6% |
| Standard Deviation (Sample) | 5.8% | 7.8% |
| Standard Deviation (Population) | 5.8% | 7.8% |
Similar Demographics by Female Poverty
Demographics Similar to Palestinians by Female Poverty
In terms of female poverty, the demographic groups most similar to Palestinians are Slavic (12.5%, a difference of 0.090%), Immigrants from China (12.5%, a difference of 0.11%), Scottish (12.5%, a difference of 0.11%), Immigrants from Turkey (12.6%, a difference of 0.23%), and Immigrants from Latvia (12.5%, a difference of 0.26%).
| Demographics | Rating | Rank | Female Poverty |
| Australians | 95.2 /100 | #97 | Exceptional 12.5% |
| Native Hawaiians | 95.1 /100 | #98 | Exceptional 12.5% |
| Romanians | 95.1 /100 | #99 | Exceptional 12.5% |
| Immigrants | Latvia | 94.8 /100 | #100 | Exceptional 12.5% |
| Tlingit-Haida | 94.8 /100 | #101 | Exceptional 12.5% |
| Immigrants | China | 94.5 /100 | #102 | Exceptional 12.5% |
| Slavs | 94.5 /100 | #103 | Exceptional 12.5% |
| Palestinians | 94.3 /100 | #104 | Exceptional 12.5% |
| Scottish | 94.1 /100 | #105 | Exceptional 12.5% |
| Immigrants | Turkey | 93.8 /100 | #106 | Exceptional 12.6% |
| Laotians | 93.4 /100 | #107 | Exceptional 12.6% |
| Portuguese | 93.1 /100 | #108 | Exceptional 12.6% |
| Immigrants | Zimbabwe | 93.1 /100 | #109 | Exceptional 12.6% |
| Paraguayans | 93.0 /100 | #110 | Exceptional 12.6% |
| Soviet Union | 92.4 /100 | #111 | Exceptional 12.6% |
Demographics Similar to Immigrants from Congo by Female Poverty
In terms of female poverty, the demographic groups most similar to Immigrants from Congo are Honduran (17.4%, a difference of 0.19%), Ute (17.5%, a difference of 0.32%), Cajun (17.5%, a difference of 0.34%), Immigrants from Dominica (17.5%, a difference of 0.42%), and Arapaho (17.5%, a difference of 0.48%).
| Demographics | Rating | Rank | Female Poverty |
| Creek | 0.0 /100 | #310 | Tragic 17.0% |
| Immigrants | Guatemala | 0.0 /100 | #311 | Tragic 17.0% |
| Immigrants | Somalia | 0.0 /100 | #312 | Tragic 17.0% |
| British West Indians | 0.0 /100 | #313 | Tragic 17.0% |
| Dutch West Indians | 0.0 /100 | #314 | Tragic 17.1% |
| U.S. Virgin Islanders | 0.0 /100 | #315 | Tragic 17.3% |
| Hondurans | 0.0 /100 | #316 | Tragic 17.4% |
| Immigrants | Congo | 0.0 /100 | #317 | Tragic 17.4% |
| Ute | 0.0 /100 | #318 | Tragic 17.5% |
| Cajuns | 0.0 /100 | #319 | Tragic 17.5% |
| Immigrants | Dominica | 0.0 /100 | #320 | Tragic 17.5% |
| Arapaho | 0.0 /100 | #321 | Tragic 17.5% |
| Menominee | 0.0 /100 | #322 | Tragic 17.6% |
| Paiute | 0.0 /100 | #323 | Tragic 17.7% |
| Immigrants | Honduras | 0.0 /100 | #324 | Tragic 17.7% |