Ghanaian vs Immigrants from Congo Female Poverty
COMPARE
Ghanaian
Immigrants from Congo
Female Poverty
Female Poverty Comparison
Ghanaians
Immigrants from Congo
14.7%
FEMALE POVERTY
1.9/ 100
METRIC RATING
229th/ 347
METRIC RANK
17.4%
FEMALE POVERTY
0.0/ 100
METRIC RATING
317th/ 347
METRIC RANK
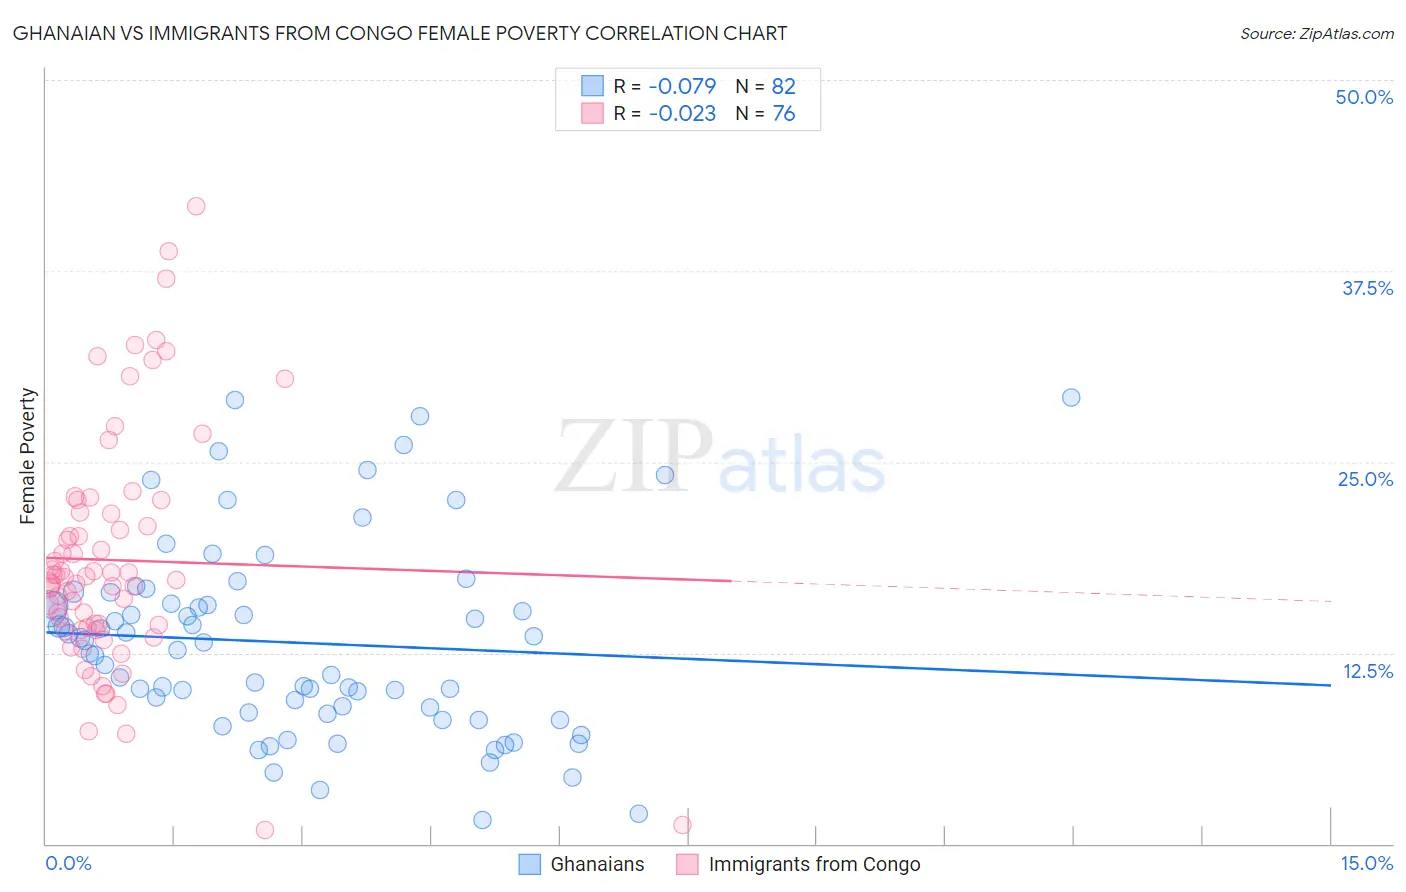
Ghanaian vs Immigrants from Congo Female Poverty Correlation Chart
The statistical analysis conducted on geographies consisting of 190,346,829 people shows a slight negative correlation between the proportion of Ghanaians and poverty level among females in the United States with a correlation coefficient (R) of -0.079 and weighted average of 14.7%. Similarly, the statistical analysis conducted on geographies consisting of 92,087,948 people shows no correlation between the proportion of Immigrants from Congo and poverty level among females in the United States with a correlation coefficient (R) of -0.023 and weighted average of 17.4%, a difference of 18.2%.
Female Poverty Correlation Summary
| Measurement | Ghanaian | Immigrants from Congo |
| Minimum | 1.5% | 0.94% |
| Maximum | 29.2% | 41.7% |
| Range | 27.7% | 40.8% |
| Mean | 13.2% | 18.6% |
| Median | 12.9% | 17.3% |
| Interquartile 25% (IQ1) | 8.6% | 14.1% |
| Interquartile 75% (IQ3) | 15.7% | 21.6% |
| Interquartile Range (IQR) | 7.1% | 7.6% |
| Standard Deviation (Sample) | 6.3% | 7.8% |
| Standard Deviation (Population) | 6.2% | 7.8% |
Similar Demographics by Female Poverty
Demographics Similar to Ghanaians by Female Poverty
In terms of female poverty, the demographic groups most similar to Ghanaians are German Russian (14.7%, a difference of 0.060%), Alaska Native (14.7%, a difference of 0.20%), Immigrants from Nigeria (14.7%, a difference of 0.21%), Nigerian (14.8%, a difference of 0.30%), and Immigrants from Eritrea (14.6%, a difference of 0.52%).
| Demographics | Rating | Rank | Female Poverty |
| Immigrants | Nonimmigrants | 3.7 /100 | #222 | Tragic 14.5% |
| Immigrants | Africa | 3.3 /100 | #223 | Tragic 14.5% |
| Americans | 2.8 /100 | #224 | Tragic 14.6% |
| Immigrants | Micronesia | 2.8 /100 | #225 | Tragic 14.6% |
| Immigrants | Eritrea | 2.4 /100 | #226 | Tragic 14.6% |
| Immigrants | Nigeria | 2.1 /100 | #227 | Tragic 14.7% |
| German Russians | 2.0 /100 | #228 | Tragic 14.7% |
| Ghanaians | 1.9 /100 | #229 | Tragic 14.7% |
| Alaska Natives | 1.8 /100 | #230 | Tragic 14.7% |
| Nigerians | 1.7 /100 | #231 | Tragic 14.8% |
| Osage | 1.5 /100 | #232 | Tragic 14.8% |
| Immigrants | Saudi Arabia | 1.4 /100 | #233 | Tragic 14.8% |
| Fijians | 1.1 /100 | #234 | Tragic 14.9% |
| Immigrants | Laos | 0.9 /100 | #235 | Tragic 15.0% |
| Cree | 0.7 /100 | #236 | Tragic 15.1% |
Demographics Similar to Immigrants from Congo by Female Poverty
In terms of female poverty, the demographic groups most similar to Immigrants from Congo are Honduran (17.4%, a difference of 0.19%), Ute (17.5%, a difference of 0.32%), Cajun (17.5%, a difference of 0.34%), Immigrants from Dominica (17.5%, a difference of 0.42%), and Arapaho (17.5%, a difference of 0.48%).
| Demographics | Rating | Rank | Female Poverty |
| Creek | 0.0 /100 | #310 | Tragic 17.0% |
| Immigrants | Guatemala | 0.0 /100 | #311 | Tragic 17.0% |
| Immigrants | Somalia | 0.0 /100 | #312 | Tragic 17.0% |
| British West Indians | 0.0 /100 | #313 | Tragic 17.0% |
| Dutch West Indians | 0.0 /100 | #314 | Tragic 17.1% |
| U.S. Virgin Islanders | 0.0 /100 | #315 | Tragic 17.3% |
| Hondurans | 0.0 /100 | #316 | Tragic 17.4% |
| Immigrants | Congo | 0.0 /100 | #317 | Tragic 17.4% |
| Ute | 0.0 /100 | #318 | Tragic 17.5% |
| Cajuns | 0.0 /100 | #319 | Tragic 17.5% |
| Immigrants | Dominica | 0.0 /100 | #320 | Tragic 17.5% |
| Arapaho | 0.0 /100 | #321 | Tragic 17.5% |
| Menominee | 0.0 /100 | #322 | Tragic 17.6% |
| Paiute | 0.0 /100 | #323 | Tragic 17.7% |
| Immigrants | Honduras | 0.0 /100 | #324 | Tragic 17.7% |