Palestinian vs Jordanian Female Poverty
COMPARE
Palestinian
Jordanian
Female Poverty
Female Poverty Comparison
Palestinians
Jordanians
12.5%
FEMALE POVERTY
94.3/ 100
METRIC RATING
104th/ 347
METRIC RANK
12.3%
FEMALE POVERTY
97.1/ 100
METRIC RATING
82nd/ 347
METRIC RANK
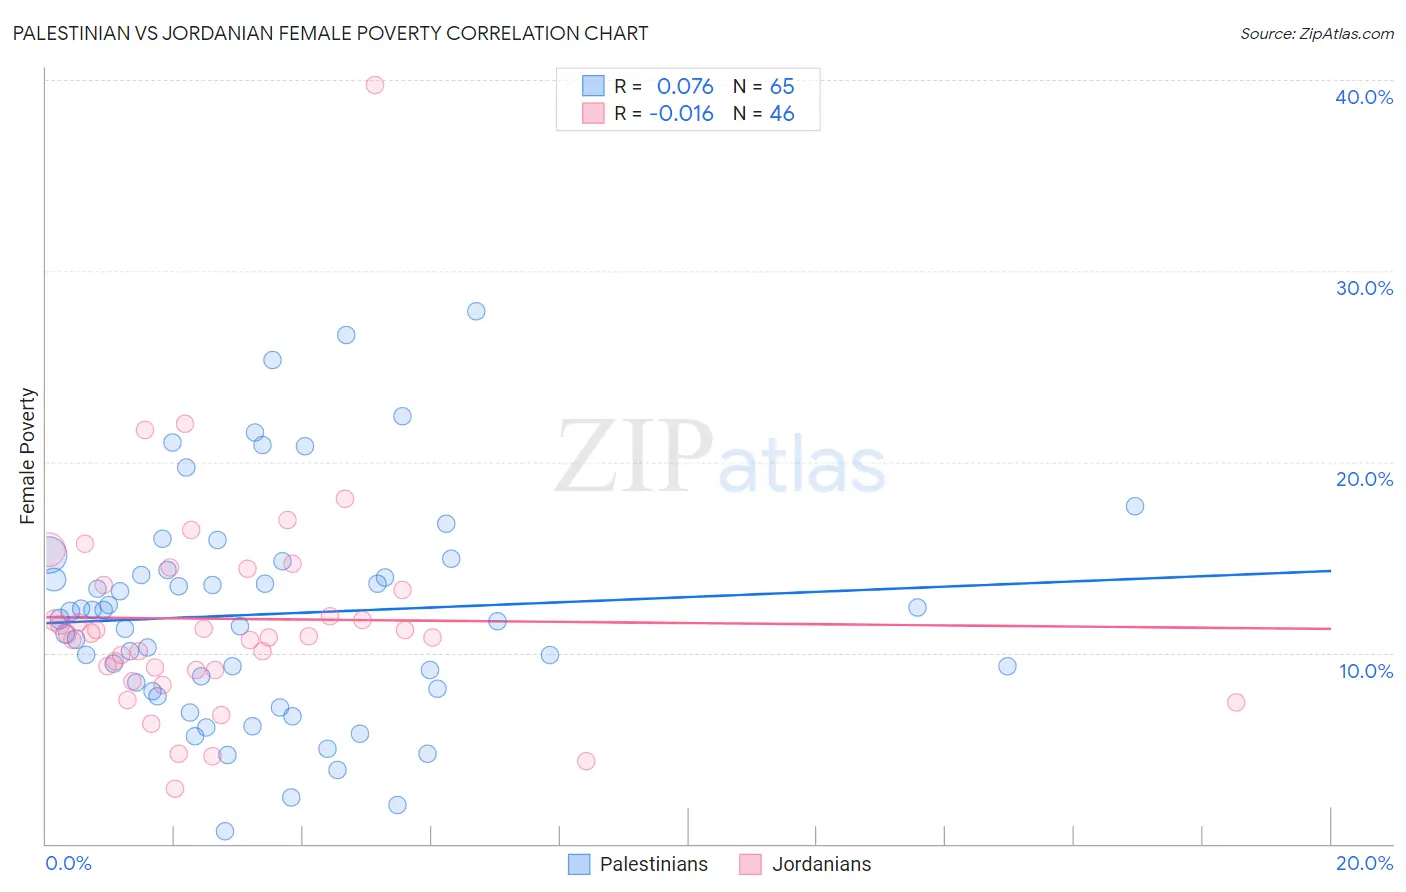
Palestinian vs Jordanian Female Poverty Correlation Chart
The statistical analysis conducted on geographies consisting of 216,371,597 people shows a slight positive correlation between the proportion of Palestinians and poverty level among females in the United States with a correlation coefficient (R) of 0.076 and weighted average of 12.5%. Similarly, the statistical analysis conducted on geographies consisting of 166,392,189 people shows no correlation between the proportion of Jordanians and poverty level among females in the United States with a correlation coefficient (R) of -0.016 and weighted average of 12.3%, a difference of 1.8%.
Female Poverty Correlation Summary
| Measurement | Palestinian | Jordanian |
| Minimum | 0.63% | 2.9% |
| Maximum | 27.9% | 39.7% |
| Range | 27.3% | 36.8% |
| Mean | 12.0% | 11.8% |
| Median | 11.8% | 10.9% |
| Interquartile 25% (IQ1) | 8.0% | 9.1% |
| Interquartile 75% (IQ3) | 14.6% | 13.6% |
| Interquartile Range (IQR) | 6.5% | 4.5% |
| Standard Deviation (Sample) | 5.8% | 5.8% |
| Standard Deviation (Population) | 5.8% | 5.8% |
Similar Demographics by Female Poverty
Demographics Similar to Palestinians by Female Poverty
In terms of female poverty, the demographic groups most similar to Palestinians are Slavic (12.5%, a difference of 0.090%), Immigrants from China (12.5%, a difference of 0.11%), Scottish (12.5%, a difference of 0.11%), Immigrants from Turkey (12.6%, a difference of 0.23%), and Immigrants from Latvia (12.5%, a difference of 0.26%).
| Demographics | Rating | Rank | Female Poverty |
| Australians | 95.2 /100 | #97 | Exceptional 12.5% |
| Native Hawaiians | 95.1 /100 | #98 | Exceptional 12.5% |
| Romanians | 95.1 /100 | #99 | Exceptional 12.5% |
| Immigrants | Latvia | 94.8 /100 | #100 | Exceptional 12.5% |
| Tlingit-Haida | 94.8 /100 | #101 | Exceptional 12.5% |
| Immigrants | China | 94.5 /100 | #102 | Exceptional 12.5% |
| Slavs | 94.5 /100 | #103 | Exceptional 12.5% |
| Palestinians | 94.3 /100 | #104 | Exceptional 12.5% |
| Scottish | 94.1 /100 | #105 | Exceptional 12.5% |
| Immigrants | Turkey | 93.8 /100 | #106 | Exceptional 12.6% |
| Laotians | 93.4 /100 | #107 | Exceptional 12.6% |
| Portuguese | 93.1 /100 | #108 | Exceptional 12.6% |
| Immigrants | Zimbabwe | 93.1 /100 | #109 | Exceptional 12.6% |
| Paraguayans | 93.0 /100 | #110 | Exceptional 12.6% |
| Soviet Union | 92.4 /100 | #111 | Exceptional 12.6% |
Demographics Similar to Jordanians by Female Poverty
In terms of female poverty, the demographic groups most similar to Jordanians are Slovak (12.3%, a difference of 0.010%), Immigrants from Sweden (12.3%, a difference of 0.010%), Immigrants from North America (12.3%, a difference of 0.060%), Egyptian (12.3%, a difference of 0.13%), and Serbian (12.3%, a difference of 0.14%).
| Demographics | Rating | Rank | Female Poverty |
| Europeans | 97.4 /100 | #75 | Exceptional 12.3% |
| Immigrants | Eastern Europe | 97.2 /100 | #76 | Exceptional 12.3% |
| Serbians | 97.2 /100 | #77 | Exceptional 12.3% |
| Egyptians | 97.2 /100 | #78 | Exceptional 12.3% |
| Immigrants | North America | 97.1 /100 | #79 | Exceptional 12.3% |
| Slovaks | 97.1 /100 | #80 | Exceptional 12.3% |
| Immigrants | Sweden | 97.1 /100 | #81 | Exceptional 12.3% |
| Jordanians | 97.1 /100 | #82 | Exceptional 12.3% |
| Immigrants | England | 96.9 /100 | #83 | Exceptional 12.3% |
| Northern Europeans | 96.6 /100 | #84 | Exceptional 12.4% |
| Irish | 96.5 /100 | #85 | Exceptional 12.4% |
| Dutch | 96.5 /100 | #86 | Exceptional 12.4% |
| Okinawans | 96.4 /100 | #87 | Exceptional 12.4% |
| Finns | 96.4 /100 | #88 | Exceptional 12.4% |
| English | 96.1 /100 | #89 | Exceptional 12.4% |