Bermudan vs Immigrants from Congo Female Poverty
COMPARE
Bermudan
Immigrants from Congo
Female Poverty
Female Poverty Comparison
Bermudans
Immigrants from Congo
14.4%
FEMALE POVERTY
5.5/ 100
METRIC RATING
212th/ 347
METRIC RANK
17.4%
FEMALE POVERTY
0.0/ 100
METRIC RATING
317th/ 347
METRIC RANK
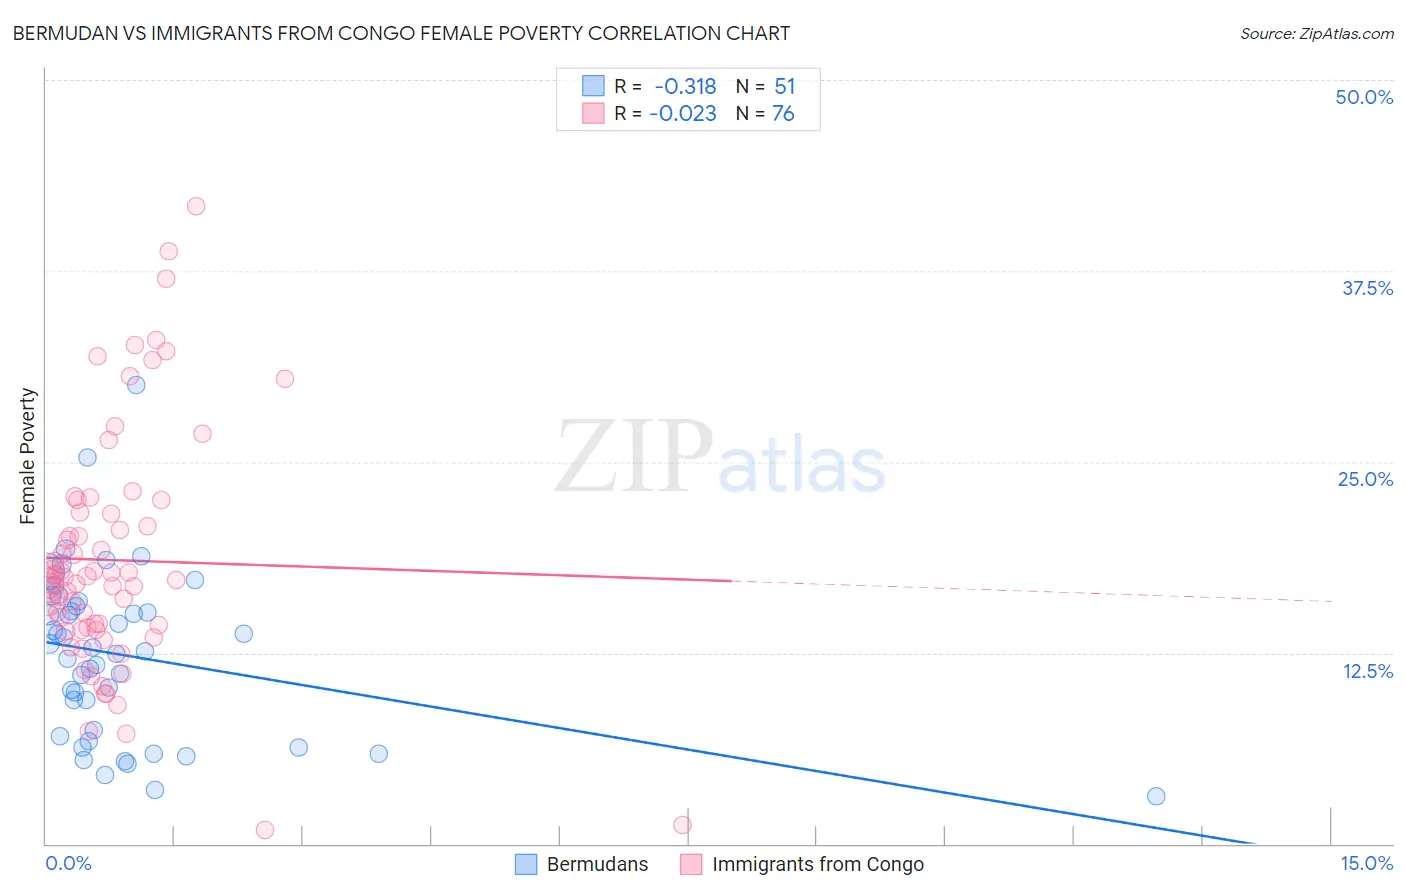
Bermudan vs Immigrants from Congo Female Poverty Correlation Chart
The statistical analysis conducted on geographies consisting of 55,716,155 people shows a mild negative correlation between the proportion of Bermudans and poverty level among females in the United States with a correlation coefficient (R) of -0.318 and weighted average of 14.4%. Similarly, the statistical analysis conducted on geographies consisting of 92,087,948 people shows no correlation between the proportion of Immigrants from Congo and poverty level among females in the United States with a correlation coefficient (R) of -0.023 and weighted average of 17.4%, a difference of 21.1%.
Female Poverty Correlation Summary
| Measurement | Bermudan | Immigrants from Congo |
| Minimum | 3.1% | 0.94% |
| Maximum | 30.0% | 41.7% |
| Range | 26.9% | 40.8% |
| Mean | 12.3% | 18.6% |
| Median | 12.6% | 17.3% |
| Interquartile 25% (IQ1) | 7.0% | 14.1% |
| Interquartile 75% (IQ3) | 15.6% | 21.6% |
| Interquartile Range (IQR) | 8.5% | 7.6% |
| Standard Deviation (Sample) | 5.5% | 7.8% |
| Standard Deviation (Population) | 5.5% | 7.8% |
Similar Demographics by Female Poverty
Demographics Similar to Bermudans by Female Poverty
In terms of female poverty, the demographic groups most similar to Bermudans are Alaskan Athabascan (14.4%, a difference of 0.080%), Marshallese (14.4%, a difference of 0.24%), Immigrants from Panama (14.4%, a difference of 0.39%), Immigrants from Thailand (14.4%, a difference of 0.47%), and Immigrants (14.4%, a difference of 0.51%).
| Demographics | Rating | Rank | Female Poverty |
| Ugandans | 15.4 /100 | #205 | Poor 14.0% |
| Immigrants | Uruguay | 14.0 /100 | #206 | Poor 14.0% |
| Immigrants | Eastern Africa | 9.0 /100 | #207 | Tragic 14.2% |
| Immigrants | Azores | 7.9 /100 | #208 | Tragic 14.2% |
| Panamanians | 7.7 /100 | #209 | Tragic 14.2% |
| Malaysians | 7.4 /100 | #210 | Tragic 14.3% |
| Moroccans | 7.2 /100 | #211 | Tragic 14.3% |
| Bermudans | 5.5 /100 | #212 | Tragic 14.4% |
| Alaskan Athabascans | 5.3 /100 | #213 | Tragic 14.4% |
| Marshallese | 5.0 /100 | #214 | Tragic 14.4% |
| Immigrants | Panama | 4.7 /100 | #215 | Tragic 14.4% |
| Immigrants | Thailand | 4.5 /100 | #216 | Tragic 14.4% |
| Immigrants | Immigrants | 4.5 /100 | #217 | Tragic 14.4% |
| Immigrants | Uzbekistan | 4.4 /100 | #218 | Tragic 14.4% |
| Japanese | 4.1 /100 | #219 | Tragic 14.5% |
Demographics Similar to Immigrants from Congo by Female Poverty
In terms of female poverty, the demographic groups most similar to Immigrants from Congo are Honduran (17.4%, a difference of 0.19%), Ute (17.5%, a difference of 0.32%), Cajun (17.5%, a difference of 0.34%), Immigrants from Dominica (17.5%, a difference of 0.42%), and Arapaho (17.5%, a difference of 0.48%).
| Demographics | Rating | Rank | Female Poverty |
| Creek | 0.0 /100 | #310 | Tragic 17.0% |
| Immigrants | Guatemala | 0.0 /100 | #311 | Tragic 17.0% |
| Immigrants | Somalia | 0.0 /100 | #312 | Tragic 17.0% |
| British West Indians | 0.0 /100 | #313 | Tragic 17.0% |
| Dutch West Indians | 0.0 /100 | #314 | Tragic 17.1% |
| U.S. Virgin Islanders | 0.0 /100 | #315 | Tragic 17.3% |
| Hondurans | 0.0 /100 | #316 | Tragic 17.4% |
| Immigrants | Congo | 0.0 /100 | #317 | Tragic 17.4% |
| Ute | 0.0 /100 | #318 | Tragic 17.5% |
| Cajuns | 0.0 /100 | #319 | Tragic 17.5% |
| Immigrants | Dominica | 0.0 /100 | #320 | Tragic 17.5% |
| Arapaho | 0.0 /100 | #321 | Tragic 17.5% |
| Menominee | 0.0 /100 | #322 | Tragic 17.6% |
| Paiute | 0.0 /100 | #323 | Tragic 17.7% |
| Immigrants | Honduras | 0.0 /100 | #324 | Tragic 17.7% |