Palestinian vs Spaniard Female Poverty
COMPARE
Palestinian
Spaniard
Female Poverty
Female Poverty Comparison
Palestinians
Spaniards
12.5%
FEMALE POVERTY
94.3/ 100
METRIC RATING
104th/ 347
METRIC RANK
13.9%
FEMALE POVERTY
18.9/ 100
METRIC RATING
204th/ 347
METRIC RANK
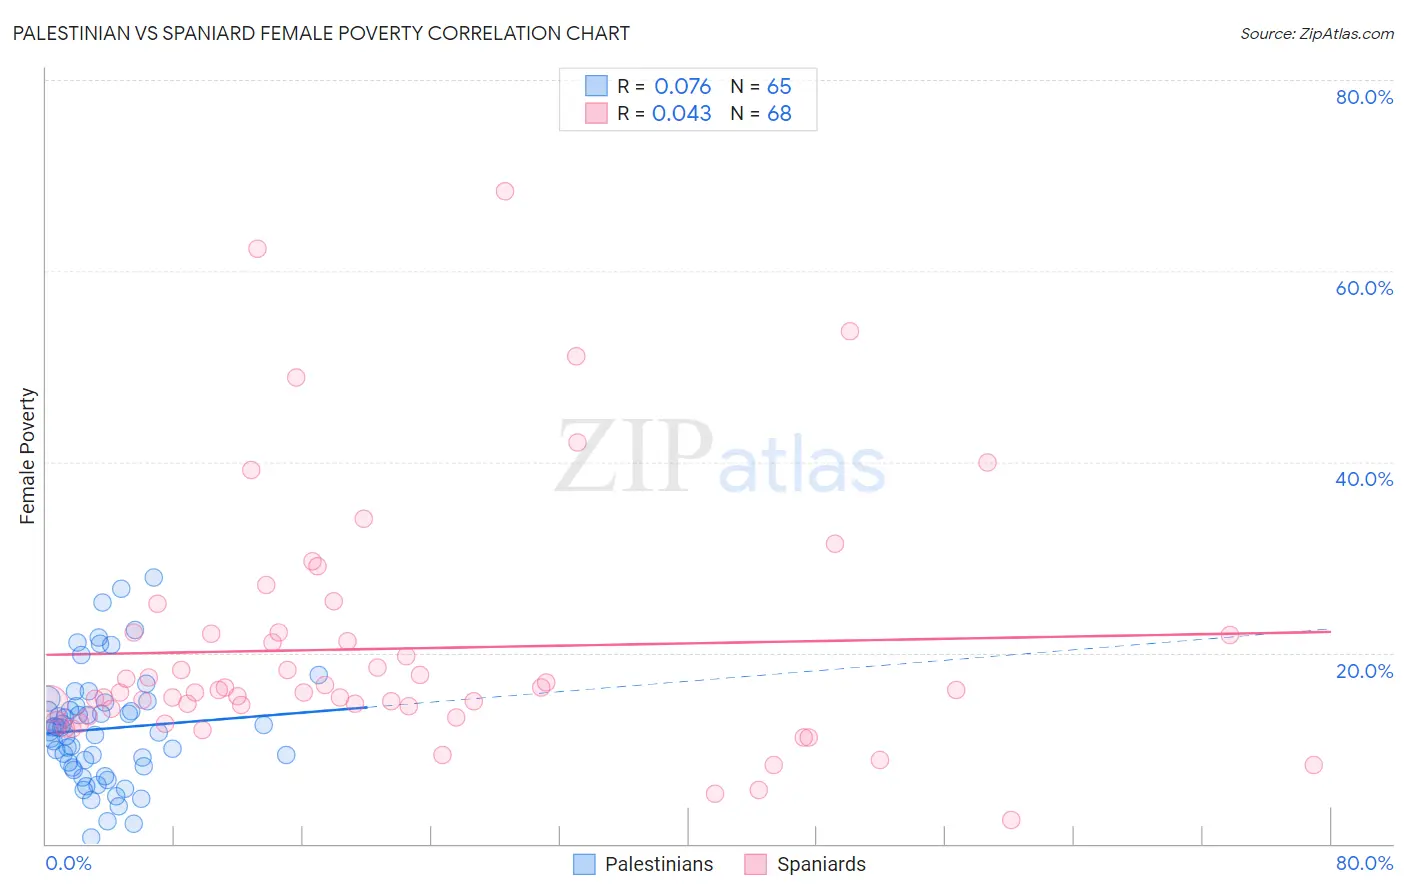
Palestinian vs Spaniard Female Poverty Correlation Chart
The statistical analysis conducted on geographies consisting of 216,371,597 people shows a slight positive correlation between the proportion of Palestinians and poverty level among females in the United States with a correlation coefficient (R) of 0.076 and weighted average of 12.5%. Similarly, the statistical analysis conducted on geographies consisting of 443,063,734 people shows no correlation between the proportion of Spaniards and poverty level among females in the United States with a correlation coefficient (R) of 0.043 and weighted average of 13.9%, a difference of 11.0%.
Female Poverty Correlation Summary
| Measurement | Palestinian | Spaniard |
| Minimum | 0.63% | 2.5% |
| Maximum | 27.9% | 68.3% |
| Range | 27.3% | 65.9% |
| Mean | 12.0% | 20.4% |
| Median | 11.8% | 15.9% |
| Interquartile 25% (IQ1) | 8.0% | 13.8% |
| Interquartile 75% (IQ3) | 14.6% | 22.0% |
| Interquartile Range (IQR) | 6.5% | 8.3% |
| Standard Deviation (Sample) | 5.8% | 13.0% |
| Standard Deviation (Population) | 5.8% | 12.9% |
Similar Demographics by Female Poverty
Demographics Similar to Palestinians by Female Poverty
In terms of female poverty, the demographic groups most similar to Palestinians are Slavic (12.5%, a difference of 0.090%), Immigrants from China (12.5%, a difference of 0.11%), Scottish (12.5%, a difference of 0.11%), Immigrants from Turkey (12.6%, a difference of 0.23%), and Immigrants from Latvia (12.5%, a difference of 0.26%).
| Demographics | Rating | Rank | Female Poverty |
| Australians | 95.2 /100 | #97 | Exceptional 12.5% |
| Native Hawaiians | 95.1 /100 | #98 | Exceptional 12.5% |
| Romanians | 95.1 /100 | #99 | Exceptional 12.5% |
| Immigrants | Latvia | 94.8 /100 | #100 | Exceptional 12.5% |
| Tlingit-Haida | 94.8 /100 | #101 | Exceptional 12.5% |
| Immigrants | China | 94.5 /100 | #102 | Exceptional 12.5% |
| Slavs | 94.5 /100 | #103 | Exceptional 12.5% |
| Palestinians | 94.3 /100 | #104 | Exceptional 12.5% |
| Scottish | 94.1 /100 | #105 | Exceptional 12.5% |
| Immigrants | Turkey | 93.8 /100 | #106 | Exceptional 12.6% |
| Laotians | 93.4 /100 | #107 | Exceptional 12.6% |
| Portuguese | 93.1 /100 | #108 | Exceptional 12.6% |
| Immigrants | Zimbabwe | 93.1 /100 | #109 | Exceptional 12.6% |
| Paraguayans | 93.0 /100 | #110 | Exceptional 12.6% |
| Soviet Union | 92.4 /100 | #111 | Exceptional 12.6% |
Demographics Similar to Spaniards by Female Poverty
In terms of female poverty, the demographic groups most similar to Spaniards are Immigrants from Western Asia (13.9%, a difference of 0.27%), Hmong (13.9%, a difference of 0.32%), Immigrants from Kenya (13.9%, a difference of 0.33%), Spanish (13.9%, a difference of 0.37%), and Ugandan (14.0%, a difference of 0.56%).
| Demographics | Rating | Rank | Female Poverty |
| Arabs | 28.6 /100 | #197 | Fair 13.7% |
| Immigrants | Uganda | 28.5 /100 | #198 | Fair 13.7% |
| Immigrants | Lebanon | 25.6 /100 | #199 | Fair 13.8% |
| Spanish | 21.4 /100 | #200 | Fair 13.9% |
| Immigrants | Kenya | 21.1 /100 | #201 | Fair 13.9% |
| Hmong | 21.1 /100 | #202 | Fair 13.9% |
| Immigrants | Western Asia | 20.7 /100 | #203 | Fair 13.9% |
| Spaniards | 18.9 /100 | #204 | Poor 13.9% |
| Ugandans | 15.4 /100 | #205 | Poor 14.0% |
| Immigrants | Uruguay | 14.0 /100 | #206 | Poor 14.0% |
| Immigrants | Eastern Africa | 9.0 /100 | #207 | Tragic 14.2% |
| Immigrants | Azores | 7.9 /100 | #208 | Tragic 14.2% |
| Panamanians | 7.7 /100 | #209 | Tragic 14.2% |
| Malaysians | 7.4 /100 | #210 | Tragic 14.3% |
| Moroccans | 7.2 /100 | #211 | Tragic 14.3% |