Immigrants from Syria vs Immigrants from Congo Female Poverty
COMPARE
Immigrants from Syria
Immigrants from Congo
Female Poverty
Female Poverty Comparison
Immigrants from Syria
Immigrants from Congo
13.5%
FEMALE POVERTY
48.8/ 100
METRIC RATING
179th/ 347
METRIC RANK
17.4%
FEMALE POVERTY
0.0/ 100
METRIC RATING
317th/ 347
METRIC RANK
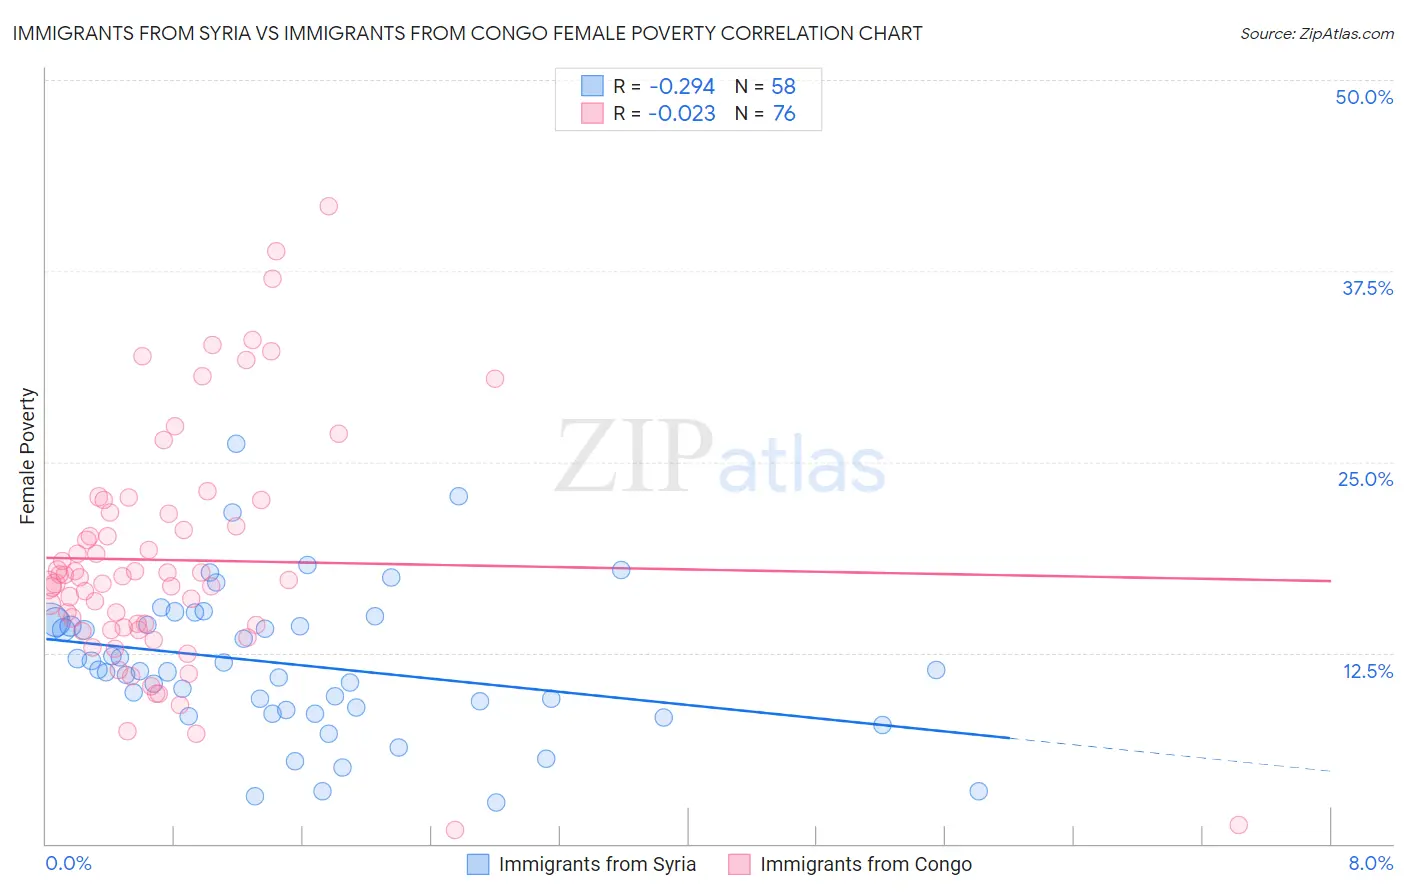
Immigrants from Syria vs Immigrants from Congo Female Poverty Correlation Chart
The statistical analysis conducted on geographies consisting of 174,099,384 people shows a weak negative correlation between the proportion of Immigrants from Syria and poverty level among females in the United States with a correlation coefficient (R) of -0.294 and weighted average of 13.5%. Similarly, the statistical analysis conducted on geographies consisting of 92,087,948 people shows no correlation between the proportion of Immigrants from Congo and poverty level among females in the United States with a correlation coefficient (R) of -0.023 and weighted average of 17.4%, a difference of 29.3%.
Female Poverty Correlation Summary
| Measurement | Immigrants from Syria | Immigrants from Congo |
| Minimum | 2.7% | 0.94% |
| Maximum | 26.2% | 41.7% |
| Range | 23.5% | 40.8% |
| Mean | 11.8% | 18.6% |
| Median | 11.3% | 17.3% |
| Interquartile 25% (IQ1) | 8.8% | 14.1% |
| Interquartile 75% (IQ3) | 14.5% | 21.6% |
| Interquartile Range (IQR) | 5.7% | 7.6% |
| Standard Deviation (Sample) | 4.8% | 7.8% |
| Standard Deviation (Population) | 4.7% | 7.8% |
Similar Demographics by Female Poverty
Demographics Similar to Immigrants from Syria by Female Poverty
In terms of female poverty, the demographic groups most similar to Immigrants from Syria are Israeli (13.5%, a difference of 0.030%), Immigrants from Morocco (13.4%, a difference of 0.060%), Immigrants from Spain (13.4%, a difference of 0.10%), Celtic (13.4%, a difference of 0.11%), and Immigrants from Iraq (13.4%, a difference of 0.12%).
| Demographics | Rating | Rank | Female Poverty |
| Mongolians | 53.6 /100 | #172 | Average 13.4% |
| Immigrants | Afghanistan | 50.8 /100 | #173 | Average 13.4% |
| Immigrants | Iraq | 50.0 /100 | #174 | Average 13.4% |
| Celtics | 49.9 /100 | #175 | Average 13.4% |
| Immigrants | Spain | 49.9 /100 | #176 | Average 13.4% |
| Immigrants | Morocco | 49.4 /100 | #177 | Average 13.4% |
| Israelis | 49.1 /100 | #178 | Average 13.5% |
| Immigrants | Syria | 48.8 /100 | #179 | Average 13.5% |
| South Americans | 44.8 /100 | #180 | Average 13.5% |
| Venezuelans | 44.5 /100 | #181 | Average 13.5% |
| Immigrants | Colombia | 44.5 /100 | #182 | Average 13.5% |
| Kenyans | 43.8 /100 | #183 | Average 13.5% |
| Immigrants | Sierra Leone | 43.2 /100 | #184 | Average 13.5% |
| Immigrants | Cameroon | 42.0 /100 | #185 | Average 13.5% |
| Immigrants | Portugal | 41.5 /100 | #186 | Average 13.6% |
Demographics Similar to Immigrants from Congo by Female Poverty
In terms of female poverty, the demographic groups most similar to Immigrants from Congo are Honduran (17.4%, a difference of 0.19%), Ute (17.5%, a difference of 0.32%), Cajun (17.5%, a difference of 0.34%), Immigrants from Dominica (17.5%, a difference of 0.42%), and Arapaho (17.5%, a difference of 0.48%).
| Demographics | Rating | Rank | Female Poverty |
| Creek | 0.0 /100 | #310 | Tragic 17.0% |
| Immigrants | Guatemala | 0.0 /100 | #311 | Tragic 17.0% |
| Immigrants | Somalia | 0.0 /100 | #312 | Tragic 17.0% |
| British West Indians | 0.0 /100 | #313 | Tragic 17.0% |
| Dutch West Indians | 0.0 /100 | #314 | Tragic 17.1% |
| U.S. Virgin Islanders | 0.0 /100 | #315 | Tragic 17.3% |
| Hondurans | 0.0 /100 | #316 | Tragic 17.4% |
| Immigrants | Congo | 0.0 /100 | #317 | Tragic 17.4% |
| Ute | 0.0 /100 | #318 | Tragic 17.5% |
| Cajuns | 0.0 /100 | #319 | Tragic 17.5% |
| Immigrants | Dominica | 0.0 /100 | #320 | Tragic 17.5% |
| Arapaho | 0.0 /100 | #321 | Tragic 17.5% |
| Menominee | 0.0 /100 | #322 | Tragic 17.6% |
| Paiute | 0.0 /100 | #323 | Tragic 17.7% |
| Immigrants | Honduras | 0.0 /100 | #324 | Tragic 17.7% |