Immigrants from Burma/Myanmar vs Immigrants from Congo Female Poverty
COMPARE
Immigrants from Burma/Myanmar
Immigrants from Congo
Female Poverty
Female Poverty Comparison
Immigrants from Burma/Myanmar
Immigrants from Congo
15.4%
FEMALE POVERTY
0.3/ 100
METRIC RATING
252nd/ 347
METRIC RANK
17.4%
FEMALE POVERTY
0.0/ 100
METRIC RATING
317th/ 347
METRIC RANK
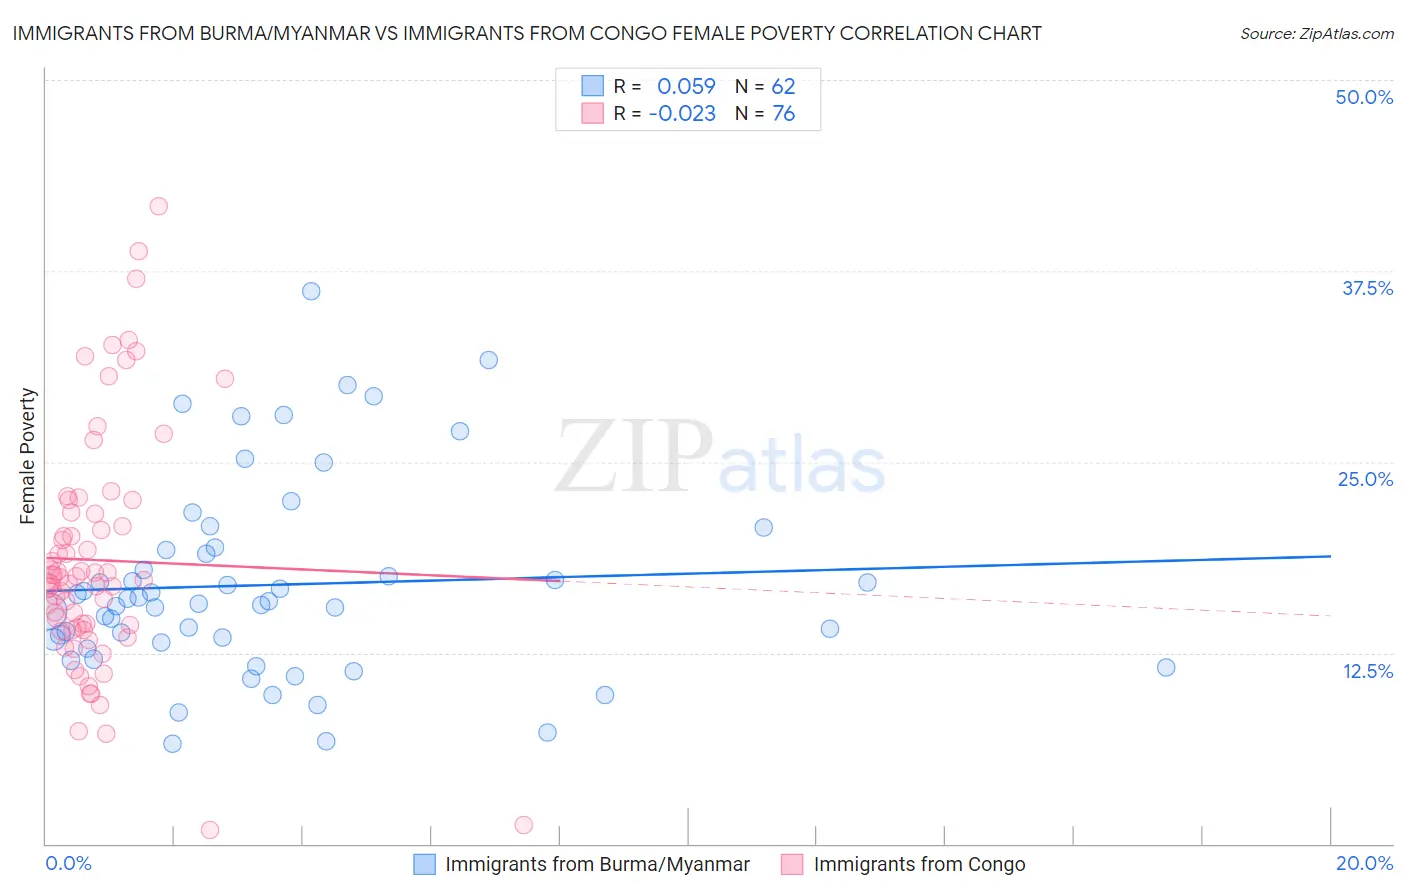
Immigrants from Burma/Myanmar vs Immigrants from Congo Female Poverty Correlation Chart
The statistical analysis conducted on geographies consisting of 172,266,194 people shows a slight positive correlation between the proportion of Immigrants from Burma/Myanmar and poverty level among females in the United States with a correlation coefficient (R) of 0.059 and weighted average of 15.4%. Similarly, the statistical analysis conducted on geographies consisting of 92,087,948 people shows no correlation between the proportion of Immigrants from Congo and poverty level among females in the United States with a correlation coefficient (R) of -0.023 and weighted average of 17.4%, a difference of 13.2%.
Female Poverty Correlation Summary
| Measurement | Immigrants from Burma/Myanmar | Immigrants from Congo |
| Minimum | 6.5% | 0.94% |
| Maximum | 36.2% | 41.7% |
| Range | 29.7% | 40.8% |
| Mean | 17.0% | 18.6% |
| Median | 15.8% | 17.3% |
| Interquartile 25% (IQ1) | 13.2% | 14.1% |
| Interquartile 75% (IQ3) | 19.2% | 21.6% |
| Interquartile Range (IQR) | 6.1% | 7.6% |
| Standard Deviation (Sample) | 6.4% | 7.8% |
| Standard Deviation (Population) | 6.4% | 7.8% |
Similar Demographics by Female Poverty
Demographics Similar to Immigrants from Burma/Myanmar by Female Poverty
In terms of female poverty, the demographic groups most similar to Immigrants from Burma/Myanmar are Immigrants from Trinidad and Tobago (15.4%, a difference of 0.030%), Immigrants from Western Africa (15.3%, a difference of 0.19%), Salvadoran (15.3%, a difference of 0.23%), Liberian (15.4%, a difference of 0.26%), and Immigrants from Ghana (15.3%, a difference of 0.37%).
| Demographics | Rating | Rank | Female Poverty |
| Spanish American Indians | 0.3 /100 | #245 | Tragic 15.3% |
| Cubans | 0.3 /100 | #246 | Tragic 15.3% |
| Potawatomi | 0.3 /100 | #247 | Tragic 15.3% |
| Immigrants | Ghana | 0.3 /100 | #248 | Tragic 15.3% |
| Salvadorans | 0.3 /100 | #249 | Tragic 15.3% |
| Immigrants | Western Africa | 0.3 /100 | #250 | Tragic 15.3% |
| Immigrants | Trinidad and Tobago | 0.3 /100 | #251 | Tragic 15.4% |
| Immigrants | Burma/Myanmar | 0.3 /100 | #252 | Tragic 15.4% |
| Liberians | 0.2 /100 | #253 | Tragic 15.4% |
| Trinidadians and Tobagonians | 0.2 /100 | #254 | Tragic 15.4% |
| Ottawa | 0.2 /100 | #255 | Tragic 15.5% |
| Jamaicans | 0.2 /100 | #256 | Tragic 15.5% |
| Immigrants | Jamaica | 0.1 /100 | #257 | Tragic 15.6% |
| Shoshone | 0.1 /100 | #258 | Tragic 15.6% |
| Cape Verdeans | 0.1 /100 | #259 | Tragic 15.6% |
Demographics Similar to Immigrants from Congo by Female Poverty
In terms of female poverty, the demographic groups most similar to Immigrants from Congo are Honduran (17.4%, a difference of 0.19%), Ute (17.5%, a difference of 0.32%), Cajun (17.5%, a difference of 0.34%), Immigrants from Dominica (17.5%, a difference of 0.42%), and Arapaho (17.5%, a difference of 0.48%).
| Demographics | Rating | Rank | Female Poverty |
| Creek | 0.0 /100 | #310 | Tragic 17.0% |
| Immigrants | Guatemala | 0.0 /100 | #311 | Tragic 17.0% |
| Immigrants | Somalia | 0.0 /100 | #312 | Tragic 17.0% |
| British West Indians | 0.0 /100 | #313 | Tragic 17.0% |
| Dutch West Indians | 0.0 /100 | #314 | Tragic 17.1% |
| U.S. Virgin Islanders | 0.0 /100 | #315 | Tragic 17.3% |
| Hondurans | 0.0 /100 | #316 | Tragic 17.4% |
| Immigrants | Congo | 0.0 /100 | #317 | Tragic 17.4% |
| Ute | 0.0 /100 | #318 | Tragic 17.5% |
| Cajuns | 0.0 /100 | #319 | Tragic 17.5% |
| Immigrants | Dominica | 0.0 /100 | #320 | Tragic 17.5% |
| Arapaho | 0.0 /100 | #321 | Tragic 17.5% |
| Menominee | 0.0 /100 | #322 | Tragic 17.6% |
| Paiute | 0.0 /100 | #323 | Tragic 17.7% |
| Immigrants | Honduras | 0.0 /100 | #324 | Tragic 17.7% |