Mongolian vs Immigrants from Congo Female Poverty
COMPARE
Mongolian
Immigrants from Congo
Female Poverty
Female Poverty Comparison
Mongolians
Immigrants from Congo
13.4%
FEMALE POVERTY
53.6/ 100
METRIC RATING
172nd/ 347
METRIC RANK
17.4%
FEMALE POVERTY
0.0/ 100
METRIC RATING
317th/ 347
METRIC RANK
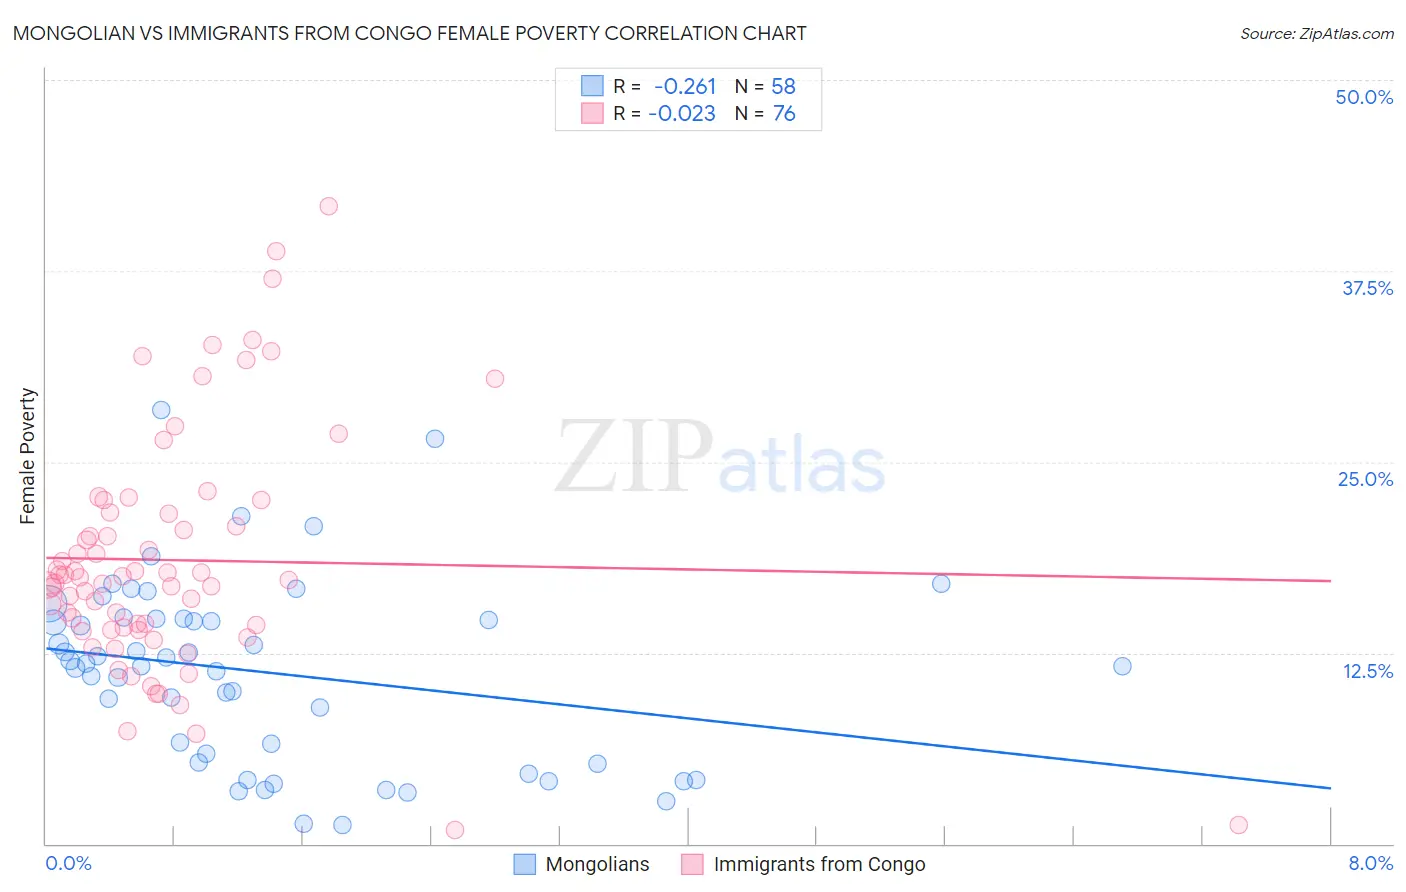
Mongolian vs Immigrants from Congo Female Poverty Correlation Chart
The statistical analysis conducted on geographies consisting of 140,282,925 people shows a weak negative correlation between the proportion of Mongolians and poverty level among females in the United States with a correlation coefficient (R) of -0.261 and weighted average of 13.4%. Similarly, the statistical analysis conducted on geographies consisting of 92,087,948 people shows no correlation between the proportion of Immigrants from Congo and poverty level among females in the United States with a correlation coefficient (R) of -0.023 and weighted average of 17.4%, a difference of 29.9%.
Female Poverty Correlation Summary
| Measurement | Mongolian | Immigrants from Congo |
| Minimum | 1.2% | 0.94% |
| Maximum | 28.4% | 41.7% |
| Range | 27.2% | 40.8% |
| Mean | 11.2% | 18.6% |
| Median | 11.7% | 17.3% |
| Interquartile 25% (IQ1) | 5.3% | 14.1% |
| Interquartile 75% (IQ3) | 14.7% | 21.6% |
| Interquartile Range (IQR) | 9.4% | 7.6% |
| Standard Deviation (Sample) | 6.0% | 7.8% |
| Standard Deviation (Population) | 5.9% | 7.8% |
Similar Demographics by Female Poverty
Demographics Similar to Mongolians by Female Poverty
In terms of female poverty, the demographic groups most similar to Mongolians are White/Caucasian (13.4%, a difference of 0.10%), Colombian (13.4%, a difference of 0.21%), Lebanese (13.4%, a difference of 0.23%), Immigrants from Afghanistan (13.4%, a difference of 0.27%), and Aleut (13.4%, a difference of 0.31%).
| Demographics | Rating | Rank | Female Poverty |
| Scotch-Irish | 62.1 /100 | #165 | Good 13.3% |
| Immigrants | Oceania | 59.7 /100 | #166 | Average 13.3% |
| Immigrants | Chile | 57.4 /100 | #167 | Average 13.3% |
| Aleuts | 56.7 /100 | #168 | Average 13.4% |
| Lebanese | 55.9 /100 | #169 | Average 13.4% |
| Colombians | 55.7 /100 | #170 | Average 13.4% |
| Whites/Caucasians | 54.6 /100 | #171 | Average 13.4% |
| Mongolians | 53.6 /100 | #172 | Average 13.4% |
| Immigrants | Afghanistan | 50.8 /100 | #173 | Average 13.4% |
| Immigrants | Iraq | 50.0 /100 | #174 | Average 13.4% |
| Celtics | 49.9 /100 | #175 | Average 13.4% |
| Immigrants | Spain | 49.9 /100 | #176 | Average 13.4% |
| Immigrants | Morocco | 49.4 /100 | #177 | Average 13.4% |
| Israelis | 49.1 /100 | #178 | Average 13.5% |
| Immigrants | Syria | 48.8 /100 | #179 | Average 13.5% |
Demographics Similar to Immigrants from Congo by Female Poverty
In terms of female poverty, the demographic groups most similar to Immigrants from Congo are Honduran (17.4%, a difference of 0.19%), Ute (17.5%, a difference of 0.32%), Cajun (17.5%, a difference of 0.34%), Immigrants from Dominica (17.5%, a difference of 0.42%), and Arapaho (17.5%, a difference of 0.48%).
| Demographics | Rating | Rank | Female Poverty |
| Creek | 0.0 /100 | #310 | Tragic 17.0% |
| Immigrants | Guatemala | 0.0 /100 | #311 | Tragic 17.0% |
| Immigrants | Somalia | 0.0 /100 | #312 | Tragic 17.0% |
| British West Indians | 0.0 /100 | #313 | Tragic 17.0% |
| Dutch West Indians | 0.0 /100 | #314 | Tragic 17.1% |
| U.S. Virgin Islanders | 0.0 /100 | #315 | Tragic 17.3% |
| Hondurans | 0.0 /100 | #316 | Tragic 17.4% |
| Immigrants | Congo | 0.0 /100 | #317 | Tragic 17.4% |
| Ute | 0.0 /100 | #318 | Tragic 17.5% |
| Cajuns | 0.0 /100 | #319 | Tragic 17.5% |
| Immigrants | Dominica | 0.0 /100 | #320 | Tragic 17.5% |
| Arapaho | 0.0 /100 | #321 | Tragic 17.5% |
| Menominee | 0.0 /100 | #322 | Tragic 17.6% |
| Paiute | 0.0 /100 | #323 | Tragic 17.7% |
| Immigrants | Honduras | 0.0 /100 | #324 | Tragic 17.7% |