Ottawa vs Immigrants from Cuba Child Poverty Among Girls Under 16
COMPARE
Ottawa
Immigrants from Cuba
Child Poverty Among Girls Under 16
Child Poverty Among Girls Under 16 Comparison
Ottawa
Immigrants from Cuba
19.4%
CHILD POVERTY AMONG GIRLS UNDER 16
0.2/ 100
METRIC RATING
259th/ 347
METRIC RANK
18.8%
CHILD POVERTY AMONG GIRLS UNDER 16
0.7/ 100
METRIC RATING
242nd/ 347
METRIC RANK
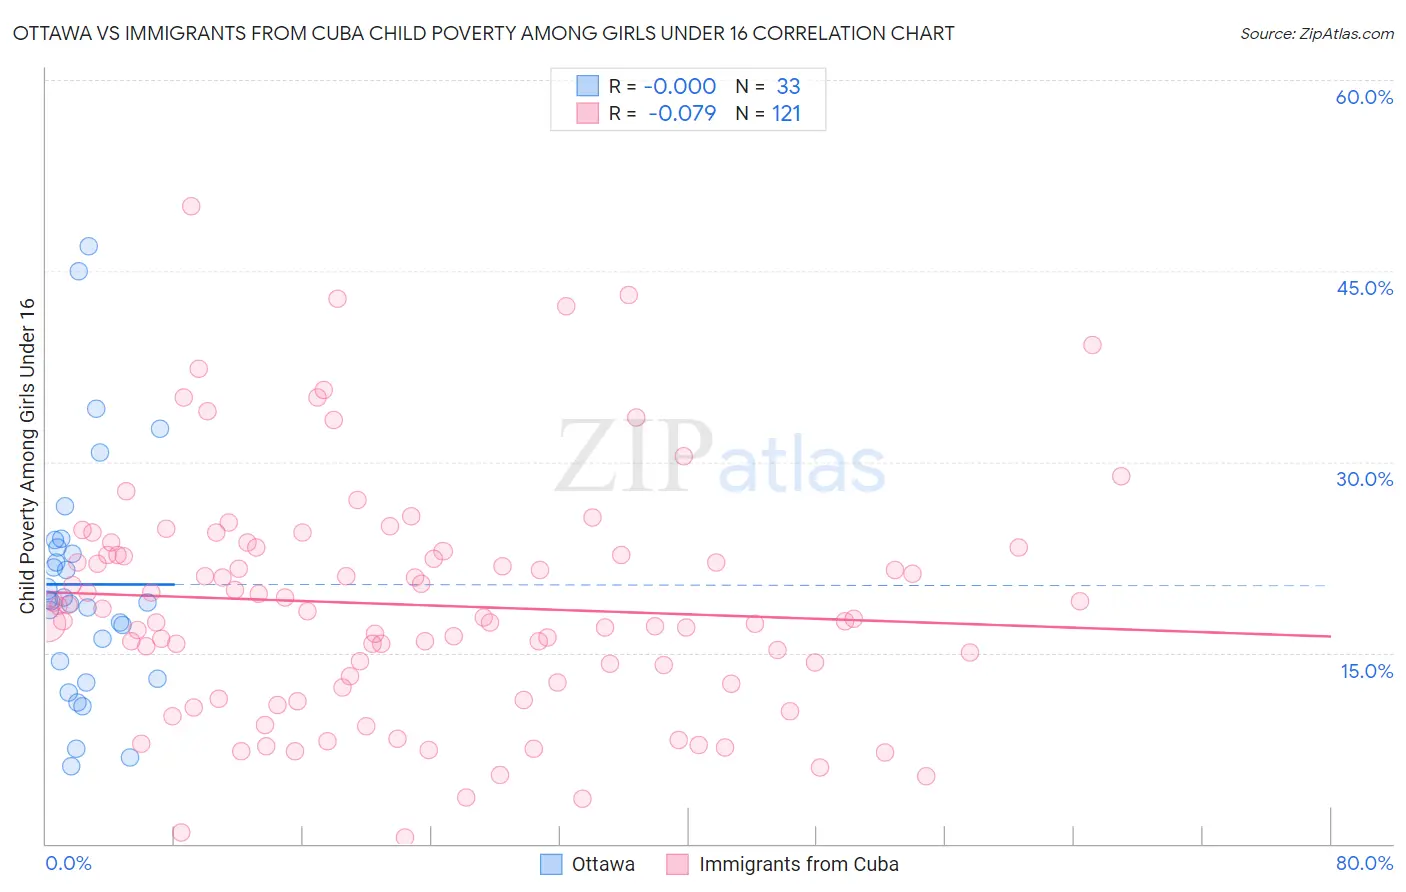
Ottawa vs Immigrants from Cuba Child Poverty Among Girls Under 16 Correlation Chart
The statistical analysis conducted on geographies consisting of 49,714,849 people shows no correlation between the proportion of Ottawa and poverty level among girls under the age of 16 in the United States with a correlation coefficient (R) of -0.000 and weighted average of 19.4%. Similarly, the statistical analysis conducted on geographies consisting of 321,897,720 people shows a slight negative correlation between the proportion of Immigrants from Cuba and poverty level among girls under the age of 16 in the United States with a correlation coefficient (R) of -0.079 and weighted average of 18.8%, a difference of 3.3%.
Child Poverty Among Girls Under 16 Correlation Summary
| Measurement | Ottawa | Immigrants from Cuba |
| Minimum | 6.1% | 0.48% |
| Maximum | 46.9% | 50.1% |
| Range | 40.9% | 49.6% |
| Mean | 20.4% | 18.8% |
| Median | 19.1% | 17.8% |
| Interquartile 25% (IQ1) | 13.7% | 12.6% |
| Interquartile 75% (IQ3) | 23.6% | 22.9% |
| Interquartile Range (IQR) | 9.9% | 10.2% |
| Standard Deviation (Sample) | 9.4% | 9.2% |
| Standard Deviation (Population) | 9.3% | 9.1% |
Demographics Similar to Ottawa and Immigrants from Cuba by Child Poverty Among Girls Under 16
In terms of child poverty among girls under 16, the demographic groups most similar to Ottawa are Salvadoran (19.4%, a difference of 0.10%), Guyanese (19.4%, a difference of 0.23%), Trinidadian and Tobagonian (19.3%, a difference of 0.47%), Immigrants from Ecuador (19.3%, a difference of 0.54%), and Immigrants from Western Africa (19.3%, a difference of 0.56%). Similarly, the demographic groups most similar to Immigrants from Cuba are American (18.8%, a difference of 0.14%), Immigrants from Nicaragua (18.8%, a difference of 0.22%), Ecuadorian (18.8%, a difference of 0.28%), Shoshone (18.9%, a difference of 0.40%), and Immigrants from Laos (18.9%, a difference of 0.43%).
| Demographics | Rating | Rank | Child Poverty Among Girls Under 16 |
| Nigerians | 0.9 /100 | #240 | Tragic 18.7% |
| Americans | 0.8 /100 | #241 | Tragic 18.8% |
| Immigrants | Cuba | 0.7 /100 | #242 | Tragic 18.8% |
| Immigrants | Nicaragua | 0.7 /100 | #243 | Tragic 18.8% |
| Ecuadorians | 0.7 /100 | #244 | Tragic 18.8% |
| Shoshone | 0.6 /100 | #245 | Tragic 18.9% |
| Immigrants | Laos | 0.6 /100 | #246 | Tragic 18.9% |
| Immigrants | Ghana | 0.5 /100 | #247 | Tragic 18.9% |
| French American Indians | 0.3 /100 | #248 | Tragic 19.2% |
| Potawatomi | 0.3 /100 | #249 | Tragic 19.2% |
| Cape Verdeans | 0.3 /100 | #250 | Tragic 19.2% |
| Immigrants | Trinidad and Tobago | 0.3 /100 | #251 | Tragic 19.2% |
| Immigrants | Middle Africa | 0.3 /100 | #252 | Tragic 19.2% |
| Immigrants | Guyana | 0.3 /100 | #253 | Tragic 19.3% |
| Immigrants | Western Africa | 0.3 /100 | #254 | Tragic 19.3% |
| Immigrants | Ecuador | 0.3 /100 | #255 | Tragic 19.3% |
| Trinidadians and Tobagonians | 0.2 /100 | #256 | Tragic 19.3% |
| Guyanese | 0.2 /100 | #257 | Tragic 19.4% |
| Salvadorans | 0.2 /100 | #258 | Tragic 19.4% |
| Ottawa | 0.2 /100 | #259 | Tragic 19.4% |
| Mexican American Indians | 0.2 /100 | #260 | Tragic 19.5% |