Ottawa vs Iraqi Child Poverty Among Girls Under 16
COMPARE
Ottawa
Iraqi
Child Poverty Among Girls Under 16
Child Poverty Among Girls Under 16 Comparison
Ottawa
Iraqis
19.4%
CHILD POVERTY AMONG GIRLS UNDER 16
0.2/ 100
METRIC RATING
259th/ 347
METRIC RANK
17.4%
CHILD POVERTY AMONG GIRLS UNDER 16
13.0/ 100
METRIC RATING
204th/ 347
METRIC RANK
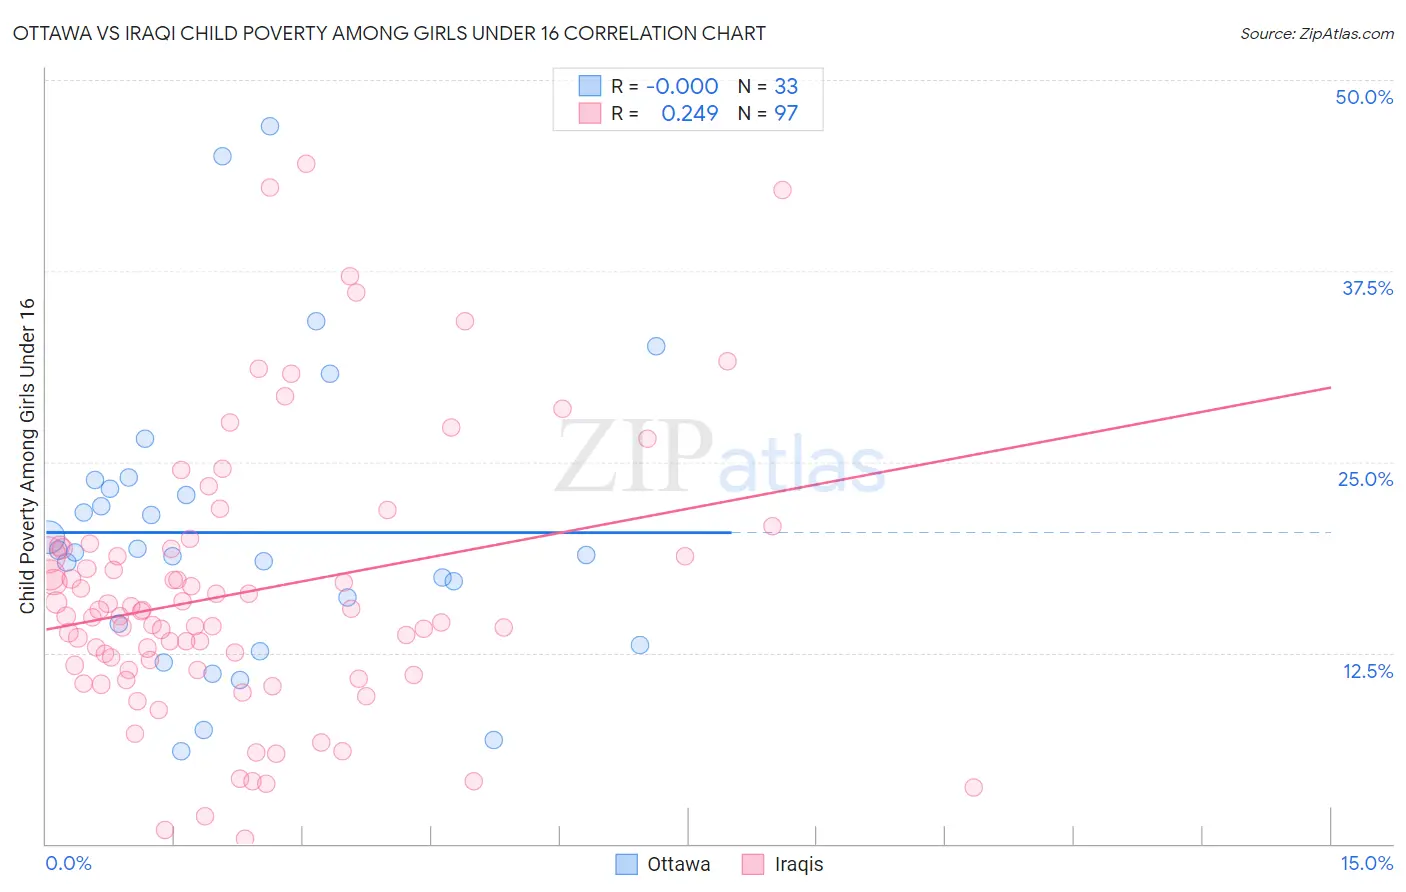
Ottawa vs Iraqi Child Poverty Among Girls Under 16 Correlation Chart
The statistical analysis conducted on geographies consisting of 49,714,849 people shows no correlation between the proportion of Ottawa and poverty level among girls under the age of 16 in the United States with a correlation coefficient (R) of -0.000 and weighted average of 19.4%. Similarly, the statistical analysis conducted on geographies consisting of 169,508,253 people shows a weak positive correlation between the proportion of Iraqis and poverty level among girls under the age of 16 in the United States with a correlation coefficient (R) of 0.249 and weighted average of 17.4%, a difference of 11.7%.
Child Poverty Among Girls Under 16 Correlation Summary
| Measurement | Ottawa | Iraqi |
| Minimum | 6.1% | 0.32% |
| Maximum | 46.9% | 44.5% |
| Range | 40.9% | 44.2% |
| Mean | 20.4% | 16.5% |
| Median | 19.1% | 14.9% |
| Interquartile 25% (IQ1) | 13.7% | 11.4% |
| Interquartile 75% (IQ3) | 23.6% | 19.3% |
| Interquartile Range (IQR) | 9.9% | 8.0% |
| Standard Deviation (Sample) | 9.4% | 8.9% |
| Standard Deviation (Population) | 9.3% | 8.9% |
Similar Demographics by Child Poverty Among Girls Under 16
Demographics Similar to Ottawa by Child Poverty Among Girls Under 16
In terms of child poverty among girls under 16, the demographic groups most similar to Ottawa are Salvadoran (19.4%, a difference of 0.10%), Guyanese (19.4%, a difference of 0.23%), Trinidadian and Tobagonian (19.3%, a difference of 0.47%), Immigrants from Ecuador (19.3%, a difference of 0.54%), and Immigrants from Western Africa (19.3%, a difference of 0.56%).
| Demographics | Rating | Rank | Child Poverty Among Girls Under 16 |
| Immigrants | Middle Africa | 0.3 /100 | #252 | Tragic 19.2% |
| Immigrants | Guyana | 0.3 /100 | #253 | Tragic 19.3% |
| Immigrants | Western Africa | 0.3 /100 | #254 | Tragic 19.3% |
| Immigrants | Ecuador | 0.3 /100 | #255 | Tragic 19.3% |
| Trinidadians and Tobagonians | 0.2 /100 | #256 | Tragic 19.3% |
| Guyanese | 0.2 /100 | #257 | Tragic 19.4% |
| Salvadorans | 0.2 /100 | #258 | Tragic 19.4% |
| Ottawa | 0.2 /100 | #259 | Tragic 19.4% |
| Mexican American Indians | 0.2 /100 | #260 | Tragic 19.5% |
| Vietnamese | 0.2 /100 | #261 | Tragic 19.5% |
| Chickasaw | 0.1 /100 | #262 | Tragic 19.6% |
| Immigrants | Burma/Myanmar | 0.1 /100 | #263 | Tragic 19.7% |
| Jamaicans | 0.1 /100 | #264 | Tragic 19.7% |
| Immigrants | Jamaica | 0.1 /100 | #265 | Tragic 19.8% |
| Spanish Americans | 0.1 /100 | #266 | Tragic 19.8% |
Demographics Similar to Iraqis by Child Poverty Among Girls Under 16
In terms of child poverty among girls under 16, the demographic groups most similar to Iraqis are Immigrants from Cameroon (17.4%, a difference of 0.10%), Delaware (17.4%, a difference of 0.37%), Hmong (17.5%, a difference of 0.62%), Ugandan (17.2%, a difference of 0.97%), and Immigrants from Sierra Leone (17.2%, a difference of 0.98%).
| Demographics | Rating | Rank | Child Poverty Among Girls Under 16 |
| Spaniards | 24.9 /100 | #197 | Fair 17.0% |
| Immigrants | Lebanon | 22.6 /100 | #198 | Fair 17.1% |
| Immigrants | Afghanistan | 22.4 /100 | #199 | Fair 17.1% |
| Immigrants | Uzbekistan | 21.5 /100 | #200 | Fair 17.1% |
| Immigrants | Kenya | 17.8 /100 | #201 | Poor 17.2% |
| Immigrants | Sierra Leone | 17.6 /100 | #202 | Poor 17.2% |
| Ugandans | 17.5 /100 | #203 | Poor 17.2% |
| Iraqis | 13.0 /100 | #204 | Poor 17.4% |
| Immigrants | Cameroon | 12.6 /100 | #205 | Poor 17.4% |
| Delaware | 11.5 /100 | #206 | Poor 17.4% |
| Hmong | 10.6 /100 | #207 | Poor 17.5% |
| Sierra Leoneans | 8.9 /100 | #208 | Tragic 17.6% |
| Panamanians | 8.7 /100 | #209 | Tragic 17.6% |
| Immigrants | Immigrants | 7.3 /100 | #210 | Tragic 17.7% |
| Immigrants | Eastern Africa | 6.4 /100 | #211 | Tragic 17.7% |