Ottawa vs Immigrants from Cuba Male Unemployment
COMPARE
Ottawa
Immigrants from Cuba
Male Unemployment
Male Unemployment Comparison
Ottawa
Immigrants from Cuba
5.7%
MALE UNEMPLOYMENT
0.9/ 100
METRIC RATING
242nd/ 347
METRIC RANK
4.4%
MALE UNEMPLOYMENT
100.0/ 100
METRIC RATING
2nd/ 347
METRIC RANK
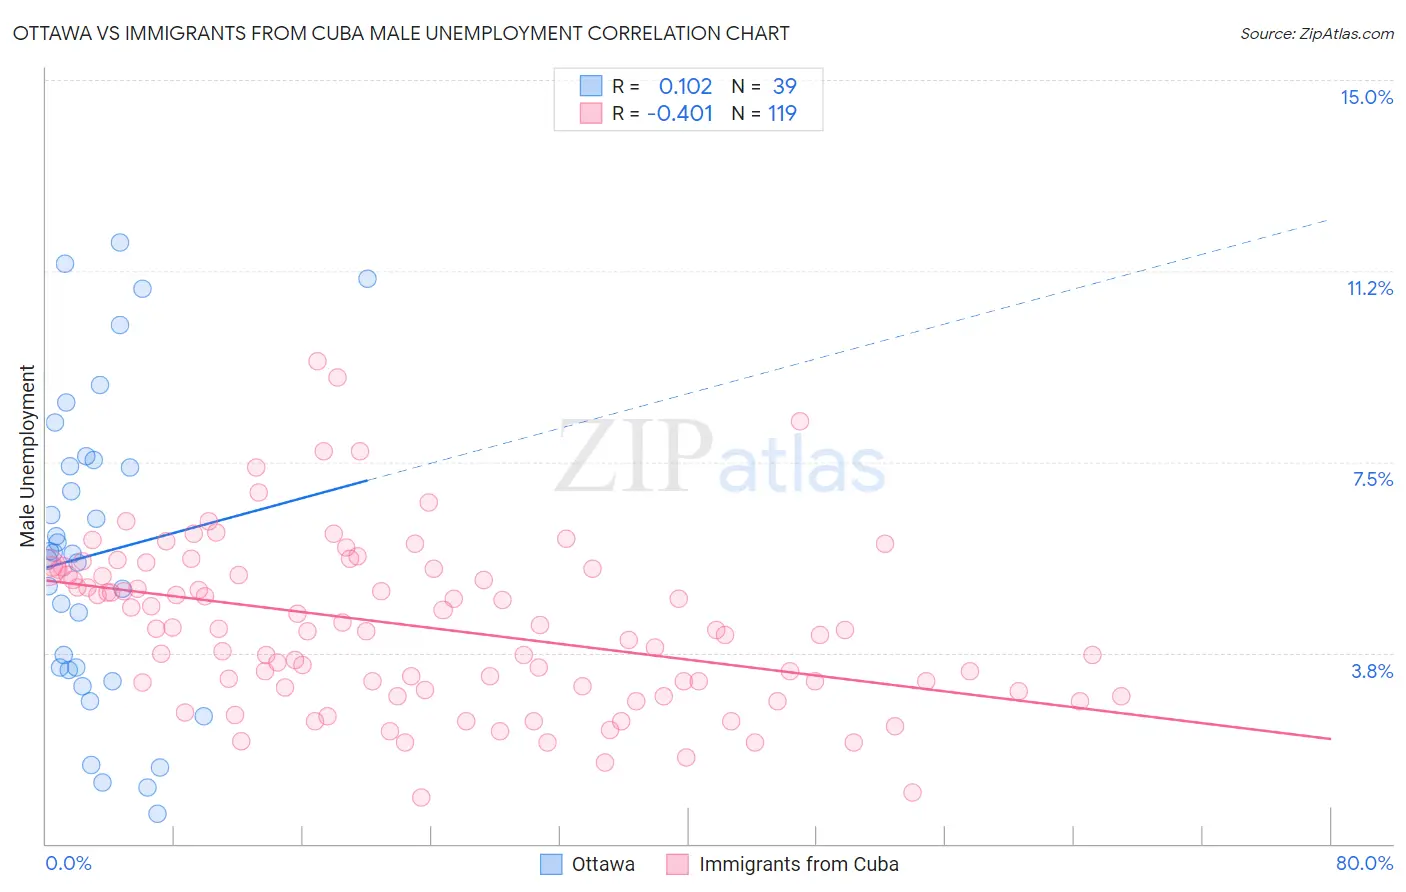
Ottawa vs Immigrants from Cuba Male Unemployment Correlation Chart
The statistical analysis conducted on geographies consisting of 49,911,932 people shows a poor positive correlation between the proportion of Ottawa and unemployment rate among males in the United States with a correlation coefficient (R) of 0.102 and weighted average of 5.7%. Similarly, the statistical analysis conducted on geographies consisting of 325,045,859 people shows a moderate negative correlation between the proportion of Immigrants from Cuba and unemployment rate among males in the United States with a correlation coefficient (R) of -0.401 and weighted average of 4.4%, a difference of 27.8%.
Male Unemployment Correlation Summary
| Measurement | Ottawa | Immigrants from Cuba |
| Minimum | 0.60% | 0.90% |
| Maximum | 11.8% | 9.5% |
| Range | 11.2% | 8.6% |
| Mean | 5.7% | 4.3% |
| Median | 5.7% | 4.2% |
| Interquartile 25% (IQ1) | 3.4% | 3.1% |
| Interquartile 75% (IQ3) | 7.5% | 5.4% |
| Interquartile Range (IQR) | 4.1% | 2.3% |
| Standard Deviation (Sample) | 3.0% | 1.6% |
| Standard Deviation (Population) | 3.0% | 1.6% |
Similar Demographics by Male Unemployment
Demographics Similar to Ottawa by Male Unemployment
In terms of male unemployment, the demographic groups most similar to Ottawa are Salvadoran (5.7%, a difference of 0.070%), Immigrants from Cameroon (5.6%, a difference of 0.11%), Immigrants from Guatemala (5.6%, a difference of 0.18%), Native Hawaiian (5.6%, a difference of 0.19%), and Honduran (5.6%, a difference of 0.23%).
| Demographics | Rating | Rank | Male Unemployment |
| Immigrants | Honduras | 1.5 /100 | #235 | Tragic 5.6% |
| Guatemalans | 1.2 /100 | #236 | Tragic 5.6% |
| Hondurans | 1.1 /100 | #237 | Tragic 5.6% |
| Native Hawaiians | 1.1 /100 | #238 | Tragic 5.6% |
| Immigrants | Guatemala | 1.1 /100 | #239 | Tragic 5.6% |
| Immigrants | Cameroon | 1.0 /100 | #240 | Tragic 5.6% |
| Salvadorans | 1.0 /100 | #241 | Tragic 5.7% |
| Ottawa | 0.9 /100 | #242 | Tragic 5.7% |
| Bangladeshis | 0.8 /100 | #243 | Tragic 5.7% |
| Immigrants | El Salvador | 0.7 /100 | #244 | Tragic 5.7% |
| Yaqui | 0.7 /100 | #245 | Tragic 5.7% |
| Iroquois | 0.6 /100 | #246 | Tragic 5.7% |
| Hawaiians | 0.6 /100 | #247 | Tragic 5.7% |
| Marshallese | 0.5 /100 | #248 | Tragic 5.7% |
| Cree | 0.4 /100 | #249 | Tragic 5.7% |
Demographics Similar to Immigrants from Cuba by Male Unemployment
In terms of male unemployment, the demographic groups most similar to Immigrants from Cuba are Norwegian (4.4%, a difference of 0.24%), Immigrants from Venezuela (4.4%, a difference of 0.58%), Immigrants from India (4.4%, a difference of 1.1%), Danish (4.5%, a difference of 1.6%), and Venezuelan (4.5%, a difference of 2.1%).
| Demographics | Rating | Rank | Male Unemployment |
| Immigrants | India | 100.0 /100 | #1 | Exceptional 4.4% |
| Immigrants | Cuba | 100.0 /100 | #2 | Exceptional 4.4% |
| Norwegians | 100.0 /100 | #3 | Exceptional 4.4% |
| Immigrants | Venezuela | 100.0 /100 | #4 | Exceptional 4.4% |
| Danes | 100.0 /100 | #5 | Exceptional 4.5% |
| Venezuelans | 100.0 /100 | #6 | Exceptional 4.5% |
| Czechs | 100.0 /100 | #7 | Exceptional 4.5% |
| Luxembourgers | 100.0 /100 | #8 | Exceptional 4.5% |
| Thais | 100.0 /100 | #9 | Exceptional 4.6% |
| Cubans | 100.0 /100 | #10 | Exceptional 4.6% |
| Swedes | 100.0 /100 | #11 | Exceptional 4.6% |
| Immigrants | Bolivia | 100.0 /100 | #12 | Exceptional 4.7% |
| Bolivians | 100.0 /100 | #13 | Exceptional 4.7% |
| Germans | 100.0 /100 | #14 | Exceptional 4.7% |
| Scandinavians | 100.0 /100 | #15 | Exceptional 4.7% |