Immigrants from Norway vs Immigrants from Cuba Child Poverty Among Girls Under 16
COMPARE
Immigrants from Norway
Immigrants from Cuba
Child Poverty Among Girls Under 16
Child Poverty Among Girls Under 16 Comparison
Immigrants from Norway
Immigrants from Cuba
15.4%
CHILD POVERTY AMONG GIRLS UNDER 16
90.8/ 100
METRIC RATING
127th/ 347
METRIC RANK
18.8%
CHILD POVERTY AMONG GIRLS UNDER 16
0.7/ 100
METRIC RATING
242nd/ 347
METRIC RANK
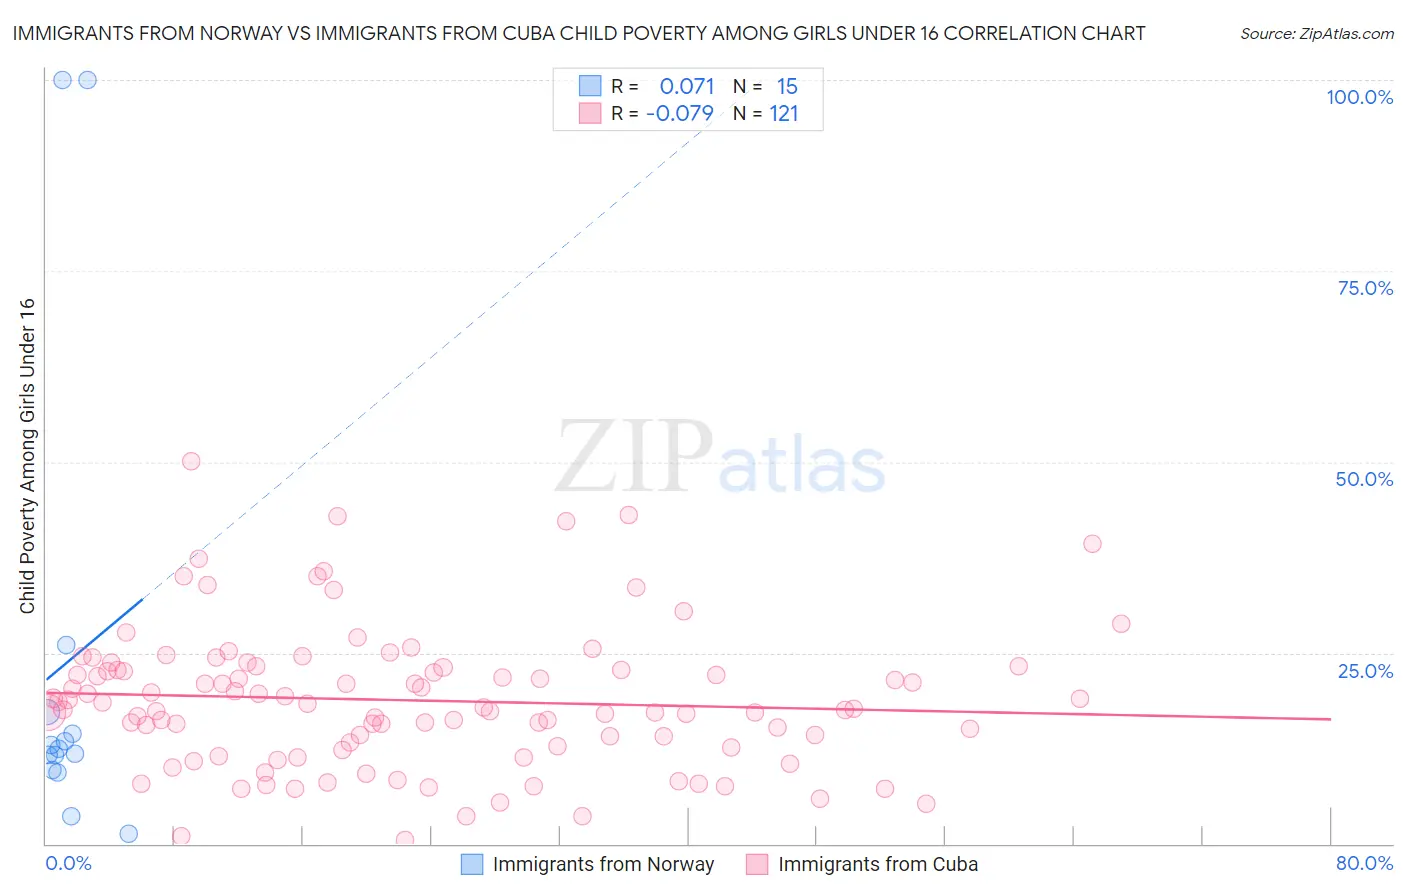
Immigrants from Norway vs Immigrants from Cuba Child Poverty Among Girls Under 16 Correlation Chart
The statistical analysis conducted on geographies consisting of 115,534,488 people shows a slight positive correlation between the proportion of Immigrants from Norway and poverty level among girls under the age of 16 in the United States with a correlation coefficient (R) of 0.071 and weighted average of 15.4%. Similarly, the statistical analysis conducted on geographies consisting of 321,897,720 people shows a slight negative correlation between the proportion of Immigrants from Cuba and poverty level among girls under the age of 16 in the United States with a correlation coefficient (R) of -0.079 and weighted average of 18.8%, a difference of 22.1%.
Child Poverty Among Girls Under 16 Correlation Summary
| Measurement | Immigrants from Norway | Immigrants from Cuba |
| Minimum | 1.3% | 0.48% |
| Maximum | 100.0% | 50.1% |
| Range | 98.7% | 49.6% |
| Mean | 23.7% | 18.8% |
| Median | 12.4% | 17.8% |
| Interquartile 25% (IQ1) | 9.7% | 12.6% |
| Interquartile 75% (IQ3) | 17.2% | 22.9% |
| Interquartile Range (IQR) | 7.5% | 10.2% |
| Standard Deviation (Sample) | 31.5% | 9.2% |
| Standard Deviation (Population) | 30.4% | 9.1% |
Similar Demographics by Child Poverty Among Girls Under 16
Demographics Similar to Immigrants from Norway by Child Poverty Among Girls Under 16
In terms of child poverty among girls under 16, the demographic groups most similar to Immigrants from Norway are Scottish (15.4%, a difference of 0.070%), Albanian (15.4%, a difference of 0.090%), Immigrants from South Eastern Asia (15.4%, a difference of 0.10%), Peruvian (15.4%, a difference of 0.13%), and Carpatho Rusyn (15.3%, a difference of 0.24%).
| Demographics | Rating | Rank | Child Poverty Among Girls Under 16 |
| Pakistanis | 92.3 /100 | #120 | Exceptional 15.3% |
| English | 92.2 /100 | #121 | Exceptional 15.3% |
| Portuguese | 91.8 /100 | #122 | Exceptional 15.3% |
| Irish | 91.5 /100 | #123 | Exceptional 15.3% |
| Carpatho Rusyns | 91.4 /100 | #124 | Exceptional 15.3% |
| Peruvians | 91.2 /100 | #125 | Exceptional 15.4% |
| Scottish | 91.0 /100 | #126 | Exceptional 15.4% |
| Immigrants | Norway | 90.8 /100 | #127 | Exceptional 15.4% |
| Albanians | 90.5 /100 | #128 | Exceptional 15.4% |
| Immigrants | South Eastern Asia | 90.5 /100 | #129 | Exceptional 15.4% |
| Puget Sound Salish | 90.1 /100 | #130 | Exceptional 15.4% |
| Immigrants | Western Europe | 90.0 /100 | #131 | Exceptional 15.4% |
| Mongolians | 89.7 /100 | #132 | Excellent 15.4% |
| Brazilians | 89.6 /100 | #133 | Excellent 15.4% |
| Immigrants | Spain | 89.1 /100 | #134 | Excellent 15.5% |
Demographics Similar to Immigrants from Cuba by Child Poverty Among Girls Under 16
In terms of child poverty among girls under 16, the demographic groups most similar to Immigrants from Cuba are American (18.8%, a difference of 0.14%), Immigrants from Nicaragua (18.8%, a difference of 0.22%), Ecuadorian (18.8%, a difference of 0.28%), Shoshone (18.9%, a difference of 0.40%), and Immigrants from Laos (18.9%, a difference of 0.43%).
| Demographics | Rating | Rank | Child Poverty Among Girls Under 16 |
| Nepalese | 1.1 /100 | #235 | Tragic 18.6% |
| Alsatians | 1.1 /100 | #236 | Tragic 18.6% |
| Immigrants | Nigeria | 1.0 /100 | #237 | Tragic 18.6% |
| Immigrants | Eritrea | 1.0 /100 | #238 | Tragic 18.7% |
| Marshallese | 0.9 /100 | #239 | Tragic 18.7% |
| Nigerians | 0.9 /100 | #240 | Tragic 18.7% |
| Americans | 0.8 /100 | #241 | Tragic 18.8% |
| Immigrants | Cuba | 0.7 /100 | #242 | Tragic 18.8% |
| Immigrants | Nicaragua | 0.7 /100 | #243 | Tragic 18.8% |
| Ecuadorians | 0.7 /100 | #244 | Tragic 18.8% |
| Shoshone | 0.6 /100 | #245 | Tragic 18.9% |
| Immigrants | Laos | 0.6 /100 | #246 | Tragic 18.9% |
| Immigrants | Ghana | 0.5 /100 | #247 | Tragic 18.9% |
| French American Indians | 0.3 /100 | #248 | Tragic 19.2% |
| Potawatomi | 0.3 /100 | #249 | Tragic 19.2% |