Ethiopian vs Immigrants from Cuba Child Poverty Among Girls Under 16
COMPARE
Ethiopian
Immigrants from Cuba
Child Poverty Among Girls Under 16
Child Poverty Among Girls Under 16 Comparison
Ethiopians
Immigrants from Cuba
16.5%
CHILD POVERTY AMONG GIRLS UNDER 16
50.0/ 100
METRIC RATING
174th/ 347
METRIC RANK
18.8%
CHILD POVERTY AMONG GIRLS UNDER 16
0.7/ 100
METRIC RATING
242nd/ 347
METRIC RANK
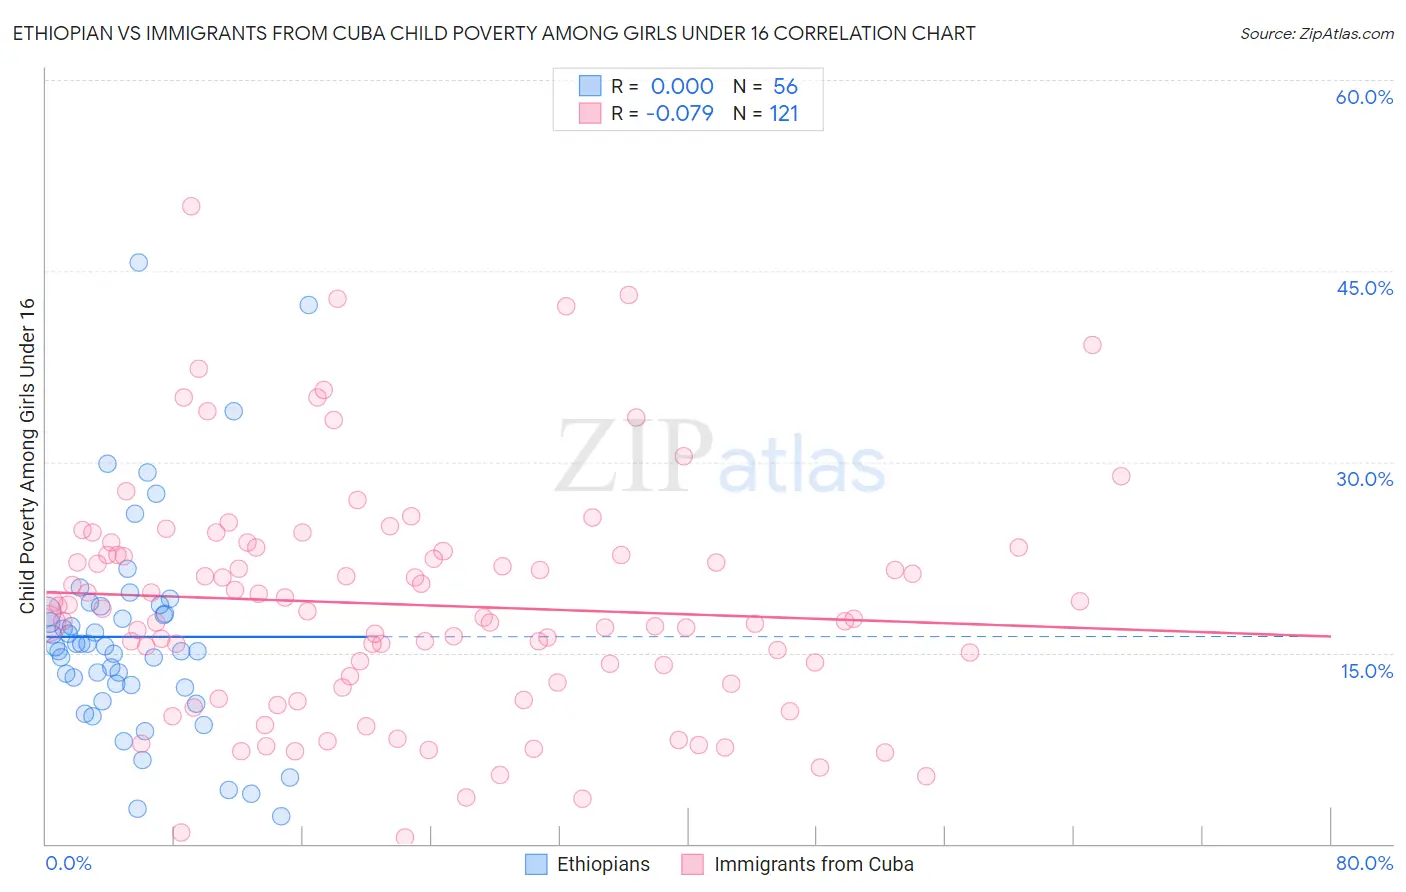
Ethiopian vs Immigrants from Cuba Child Poverty Among Girls Under 16 Correlation Chart
The statistical analysis conducted on geographies consisting of 221,230,982 people shows no correlation between the proportion of Ethiopians and poverty level among girls under the age of 16 in the United States with a correlation coefficient (R) of 0.000 and weighted average of 16.5%. Similarly, the statistical analysis conducted on geographies consisting of 321,897,720 people shows a slight negative correlation between the proportion of Immigrants from Cuba and poverty level among girls under the age of 16 in the United States with a correlation coefficient (R) of -0.079 and weighted average of 18.8%, a difference of 14.1%.
Child Poverty Among Girls Under 16 Correlation Summary
| Measurement | Ethiopian | Immigrants from Cuba |
| Minimum | 2.1% | 0.48% |
| Maximum | 45.6% | 50.1% |
| Range | 43.5% | 49.6% |
| Mean | 16.3% | 18.8% |
| Median | 15.5% | 17.8% |
| Interquartile 25% (IQ1) | 12.3% | 12.6% |
| Interquartile 75% (IQ3) | 18.5% | 22.9% |
| Interquartile Range (IQR) | 6.1% | 10.2% |
| Standard Deviation (Sample) | 8.3% | 9.2% |
| Standard Deviation (Population) | 8.3% | 9.1% |
Similar Demographics by Child Poverty Among Girls Under 16
Demographics Similar to Ethiopians by Child Poverty Among Girls Under 16
In terms of child poverty among girls under 16, the demographic groups most similar to Ethiopians are Lebanese (16.6%, a difference of 0.53%), Hungarian (16.6%, a difference of 0.56%), Immigrants from South America (16.4%, a difference of 0.59%), Immigrants from Western Asia (16.6%, a difference of 0.68%), and White/Caucasian (16.6%, a difference of 0.73%).
| Demographics | Rating | Rank | Child Poverty Among Girls Under 16 |
| Uruguayans | 64.7 /100 | #167 | Good 16.2% |
| Yugoslavians | 64.4 /100 | #168 | Good 16.2% |
| Costa Ricans | 64.2 /100 | #169 | Good 16.2% |
| Immigrants | Venezuela | 64.2 /100 | #170 | Good 16.2% |
| Immigrants | Saudi Arabia | 64.0 /100 | #171 | Good 16.2% |
| Afghans | 62.3 /100 | #172 | Good 16.2% |
| Immigrants | South America | 55.1 /100 | #173 | Average 16.4% |
| Ethiopians | 50.0 /100 | #174 | Average 16.5% |
| Lebanese | 45.4 /100 | #175 | Average 16.6% |
| Hungarians | 45.1 /100 | #176 | Average 16.6% |
| Immigrants | Western Asia | 44.1 /100 | #177 | Average 16.6% |
| Whites/Caucasians | 43.6 /100 | #178 | Average 16.6% |
| Hawaiians | 43.4 /100 | #179 | Average 16.6% |
| Immigrants | Syria | 43.3 /100 | #180 | Average 16.6% |
| Immigrants | Iraq | 43.2 /100 | #181 | Average 16.6% |
Demographics Similar to Immigrants from Cuba by Child Poverty Among Girls Under 16
In terms of child poverty among girls under 16, the demographic groups most similar to Immigrants from Cuba are American (18.8%, a difference of 0.14%), Immigrants from Nicaragua (18.8%, a difference of 0.22%), Ecuadorian (18.8%, a difference of 0.28%), Shoshone (18.9%, a difference of 0.40%), and Immigrants from Laos (18.9%, a difference of 0.43%).
| Demographics | Rating | Rank | Child Poverty Among Girls Under 16 |
| Nepalese | 1.1 /100 | #235 | Tragic 18.6% |
| Alsatians | 1.1 /100 | #236 | Tragic 18.6% |
| Immigrants | Nigeria | 1.0 /100 | #237 | Tragic 18.6% |
| Immigrants | Eritrea | 1.0 /100 | #238 | Tragic 18.7% |
| Marshallese | 0.9 /100 | #239 | Tragic 18.7% |
| Nigerians | 0.9 /100 | #240 | Tragic 18.7% |
| Americans | 0.8 /100 | #241 | Tragic 18.8% |
| Immigrants | Cuba | 0.7 /100 | #242 | Tragic 18.8% |
| Immigrants | Nicaragua | 0.7 /100 | #243 | Tragic 18.8% |
| Ecuadorians | 0.7 /100 | #244 | Tragic 18.8% |
| Shoshone | 0.6 /100 | #245 | Tragic 18.9% |
| Immigrants | Laos | 0.6 /100 | #246 | Tragic 18.9% |
| Immigrants | Ghana | 0.5 /100 | #247 | Tragic 18.9% |
| French American Indians | 0.3 /100 | #248 | Tragic 19.2% |
| Potawatomi | 0.3 /100 | #249 | Tragic 19.2% |