Ottawa vs Immigrants from Cuba 4th Grade
COMPARE
Ottawa
Immigrants from Cuba
4th Grade
4th Grade Comparison
Ottawa
Immigrants from Cuba
98.1%
4TH GRADE
99.9/ 100
METRIC RATING
46th/ 347
METRIC RANK
96.4%
4TH GRADE
0.0/ 100
METRIC RATING
302nd/ 347
METRIC RANK
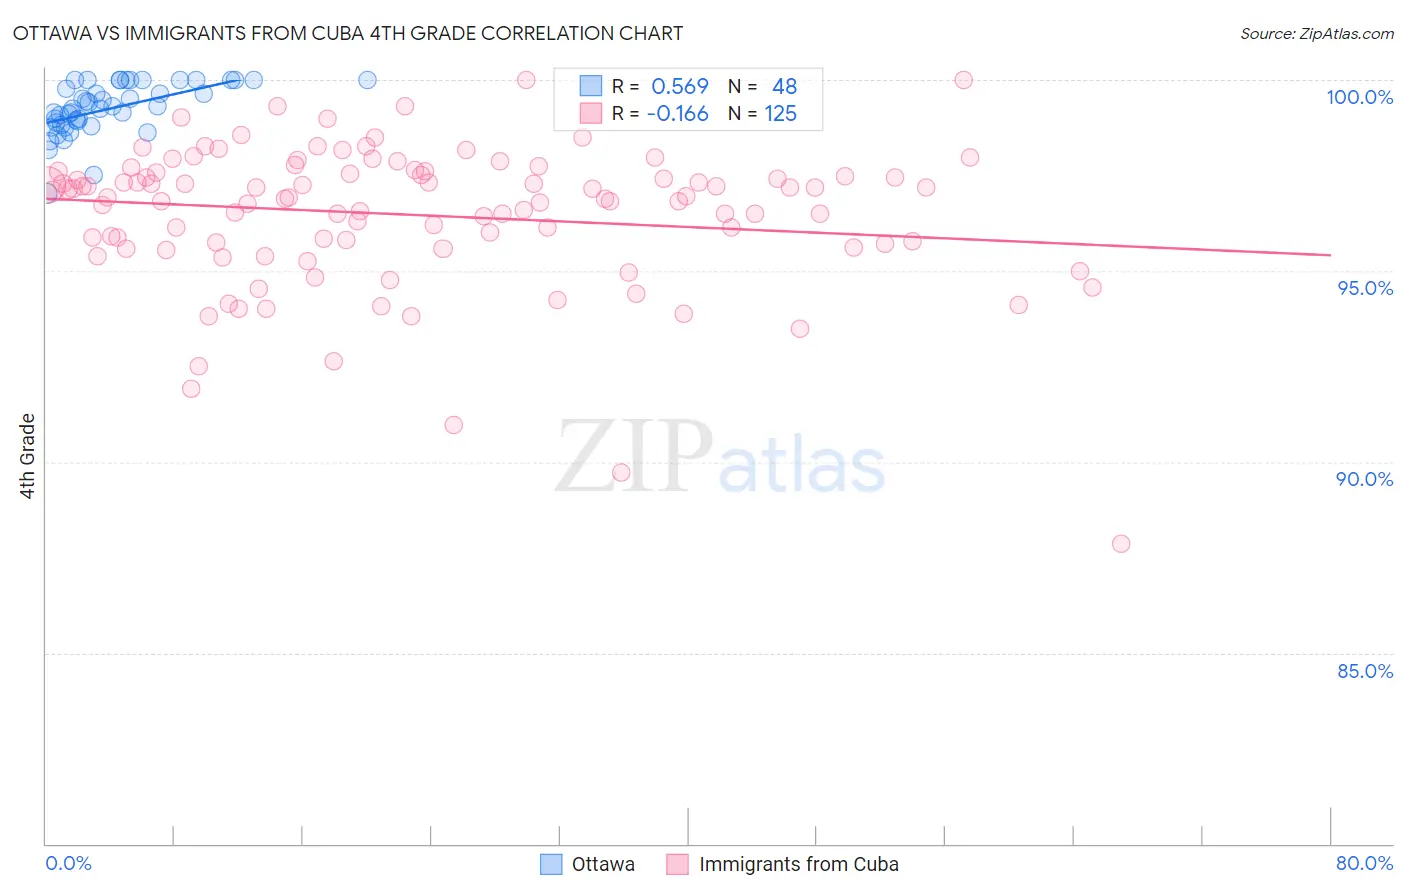
Ottawa vs Immigrants from Cuba 4th Grade Correlation Chart
The statistical analysis conducted on geographies consisting of 49,956,726 people shows a substantial positive correlation between the proportion of Ottawa and percentage of population with at least 4th grade education in the United States with a correlation coefficient (R) of 0.569 and weighted average of 98.1%. Similarly, the statistical analysis conducted on geographies consisting of 326,028,159 people shows a poor negative correlation between the proportion of Immigrants from Cuba and percentage of population with at least 4th grade education in the United States with a correlation coefficient (R) of -0.166 and weighted average of 96.4%, a difference of 1.8%.
4th Grade Correlation Summary
| Measurement | Ottawa | Immigrants from Cuba |
| Minimum | 97.0% | 87.9% |
| Maximum | 100.0% | 100.0% |
| Range | 3.0% | 12.1% |
| Mean | 99.3% | 96.5% |
| Median | 99.3% | 96.9% |
| Interquartile 25% (IQ1) | 98.9% | 95.7% |
| Interquartile 75% (IQ3) | 100.0% | 97.6% |
| Interquartile Range (IQR) | 1.1% | 1.9% |
| Standard Deviation (Sample) | 0.67% | 1.9% |
| Standard Deviation (Population) | 0.67% | 1.9% |
Similar Demographics by 4th Grade
Demographics Similar to Ottawa by 4th Grade
In terms of 4th grade, the demographic groups most similar to Ottawa are Czechoslovakian (98.1%, a difference of 0.0%), Arapaho (98.1%, a difference of 0.0%), Native Hawaiian (98.1%, a difference of 0.020%), Estonian (98.1%, a difference of 0.020%), and Bulgarian (98.1%, a difference of 0.020%).
| Demographics | Rating | Rank | 4th Grade |
| Belgians | 99.9 /100 | #39 | Exceptional 98.2% |
| Luxembourgers | 99.9 /100 | #40 | Exceptional 98.2% |
| Eastern Europeans | 99.9 /100 | #41 | Exceptional 98.2% |
| Hungarians | 99.9 /100 | #42 | Exceptional 98.2% |
| Northern Europeans | 99.9 /100 | #43 | Exceptional 98.2% |
| Native Hawaiians | 99.9 /100 | #44 | Exceptional 98.1% |
| Czechoslovakians | 99.9 /100 | #45 | Exceptional 98.1% |
| Ottawa | 99.9 /100 | #46 | Exceptional 98.1% |
| Arapaho | 99.9 /100 | #47 | Exceptional 98.1% |
| Estonians | 99.8 /100 | #48 | Exceptional 98.1% |
| Bulgarians | 99.8 /100 | #49 | Exceptional 98.1% |
| Immigrants | Scotland | 99.8 /100 | #50 | Exceptional 98.1% |
| Celtics | 99.8 /100 | #51 | Exceptional 98.1% |
| Australians | 99.8 /100 | #52 | Exceptional 98.1% |
| Slavs | 99.8 /100 | #53 | Exceptional 98.1% |
Demographics Similar to Immigrants from Cuba by 4th Grade
In terms of 4th grade, the demographic groups most similar to Immigrants from Cuba are Immigrants (96.5%, a difference of 0.030%), Guyanese (96.4%, a difference of 0.050%), Ecuadorian (96.4%, a difference of 0.060%), Immigrants from Caribbean (96.4%, a difference of 0.070%), and Immigrants from South Eastern Asia (96.5%, a difference of 0.080%).
| Demographics | Rating | Rank | 4th Grade |
| Immigrants | Portugal | 0.0 /100 | #295 | Tragic 96.6% |
| Somalis | 0.0 /100 | #296 | Tragic 96.6% |
| Immigrants | Somalia | 0.0 /100 | #297 | Tragic 96.5% |
| Haitians | 0.0 /100 | #298 | Tragic 96.5% |
| Immigrants | Dominica | 0.0 /100 | #299 | Tragic 96.5% |
| Immigrants | South Eastern Asia | 0.0 /100 | #300 | Tragic 96.5% |
| Immigrants | Immigrants | 0.0 /100 | #301 | Tragic 96.5% |
| Immigrants | Cuba | 0.0 /100 | #302 | Tragic 96.4% |
| Guyanese | 0.0 /100 | #303 | Tragic 96.4% |
| Ecuadorians | 0.0 /100 | #304 | Tragic 96.4% |
| Immigrants | Caribbean | 0.0 /100 | #305 | Tragic 96.4% |
| Sri Lankans | 0.0 /100 | #306 | Tragic 96.4% |
| Immigrants | Haiti | 0.0 /100 | #307 | Tragic 96.3% |
| Immigrants | Laos | 0.0 /100 | #308 | Tragic 96.3% |
| Immigrants | Guyana | 0.0 /100 | #309 | Tragic 96.3% |