Ottawa vs Immigrants from Haiti Child Poverty Among Girls Under 16
COMPARE
Ottawa
Immigrants from Haiti
Child Poverty Among Girls Under 16
Child Poverty Among Girls Under 16 Comparison
Ottawa
Immigrants from Haiti
19.4%
CHILD POVERTY AMONG GIRLS UNDER 16
0.2/ 100
METRIC RATING
259th/ 347
METRIC RANK
20.6%
CHILD POVERTY AMONG GIRLS UNDER 16
0.0/ 100
METRIC RATING
290th/ 347
METRIC RANK
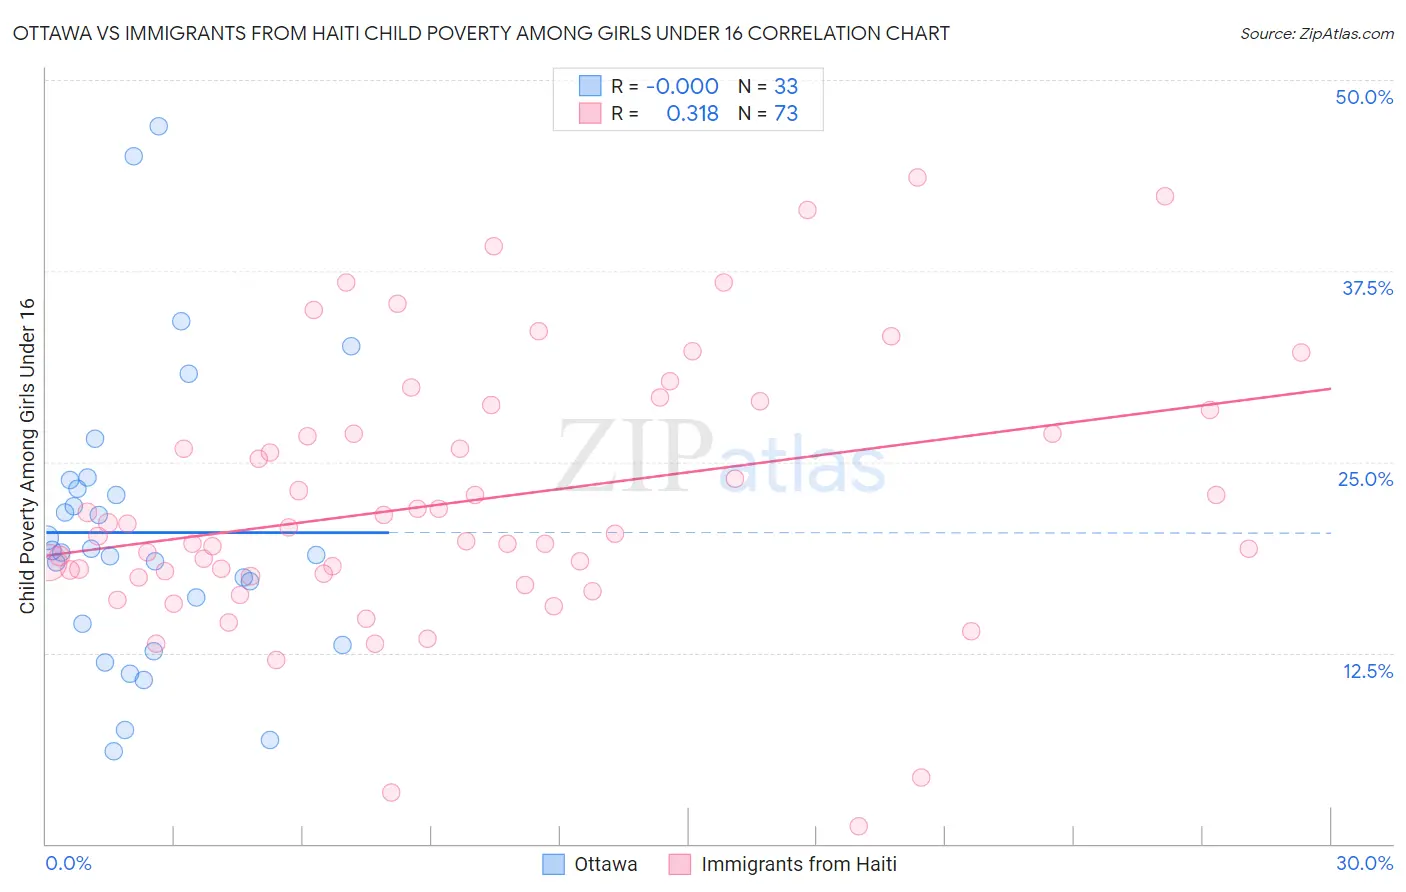
Ottawa vs Immigrants from Haiti Child Poverty Among Girls Under 16 Correlation Chart
The statistical analysis conducted on geographies consisting of 49,714,849 people shows no correlation between the proportion of Ottawa and poverty level among girls under the age of 16 in the United States with a correlation coefficient (R) of -0.000 and weighted average of 19.4%. Similarly, the statistical analysis conducted on geographies consisting of 222,631,000 people shows a mild positive correlation between the proportion of Immigrants from Haiti and poverty level among girls under the age of 16 in the United States with a correlation coefficient (R) of 0.318 and weighted average of 20.6%, a difference of 6.2%.
Child Poverty Among Girls Under 16 Correlation Summary
| Measurement | Ottawa | Immigrants from Haiti |
| Minimum | 6.1% | 1.1% |
| Maximum | 46.9% | 43.6% |
| Range | 40.9% | 42.5% |
| Mean | 20.4% | 22.4% |
| Median | 19.1% | 20.3% |
| Interquartile 25% (IQ1) | 13.7% | 17.6% |
| Interquartile 75% (IQ3) | 23.6% | 27.6% |
| Interquartile Range (IQR) | 9.9% | 10.0% |
| Standard Deviation (Sample) | 9.4% | 8.6% |
| Standard Deviation (Population) | 9.3% | 8.5% |
Similar Demographics by Child Poverty Among Girls Under 16
Demographics Similar to Ottawa by Child Poverty Among Girls Under 16
In terms of child poverty among girls under 16, the demographic groups most similar to Ottawa are Salvadoran (19.4%, a difference of 0.10%), Guyanese (19.4%, a difference of 0.23%), Trinidadian and Tobagonian (19.3%, a difference of 0.47%), Immigrants from Ecuador (19.3%, a difference of 0.54%), and Immigrants from Western Africa (19.3%, a difference of 0.56%).
| Demographics | Rating | Rank | Child Poverty Among Girls Under 16 |
| Immigrants | Middle Africa | 0.3 /100 | #252 | Tragic 19.2% |
| Immigrants | Guyana | 0.3 /100 | #253 | Tragic 19.3% |
| Immigrants | Western Africa | 0.3 /100 | #254 | Tragic 19.3% |
| Immigrants | Ecuador | 0.3 /100 | #255 | Tragic 19.3% |
| Trinidadians and Tobagonians | 0.2 /100 | #256 | Tragic 19.3% |
| Guyanese | 0.2 /100 | #257 | Tragic 19.4% |
| Salvadorans | 0.2 /100 | #258 | Tragic 19.4% |
| Ottawa | 0.2 /100 | #259 | Tragic 19.4% |
| Mexican American Indians | 0.2 /100 | #260 | Tragic 19.5% |
| Vietnamese | 0.2 /100 | #261 | Tragic 19.5% |
| Chickasaw | 0.1 /100 | #262 | Tragic 19.6% |
| Immigrants | Burma/Myanmar | 0.1 /100 | #263 | Tragic 19.7% |
| Jamaicans | 0.1 /100 | #264 | Tragic 19.7% |
| Immigrants | Jamaica | 0.1 /100 | #265 | Tragic 19.8% |
| Spanish Americans | 0.1 /100 | #266 | Tragic 19.8% |
Demographics Similar to Immigrants from Haiti by Child Poverty Among Girls Under 16
In terms of child poverty among girls under 16, the demographic groups most similar to Immigrants from Haiti are Immigrants from Belize (20.6%, a difference of 0.070%), Chippewa (20.6%, a difference of 0.13%), Immigrants from Latin America (20.6%, a difference of 0.20%), Immigrants from Grenada (20.7%, a difference of 0.24%), and Immigrants from Senegal (20.7%, a difference of 0.35%).
| Demographics | Rating | Rank | Child Poverty Among Girls Under 16 |
| Senegalese | 0.0 /100 | #283 | Tragic 20.3% |
| Yaqui | 0.0 /100 | #284 | Tragic 20.3% |
| Immigrants | Cabo Verde | 0.0 /100 | #285 | Tragic 20.3% |
| Iroquois | 0.0 /100 | #286 | Tragic 20.4% |
| Blackfeet | 0.0 /100 | #287 | Tragic 20.5% |
| Haitians | 0.0 /100 | #288 | Tragic 20.5% |
| Immigrants | Belize | 0.0 /100 | #289 | Tragic 20.6% |
| Immigrants | Haiti | 0.0 /100 | #290 | Tragic 20.6% |
| Chippewa | 0.0 /100 | #291 | Tragic 20.6% |
| Immigrants | Latin America | 0.0 /100 | #292 | Tragic 20.6% |
| Immigrants | Grenada | 0.0 /100 | #293 | Tragic 20.7% |
| Immigrants | Senegal | 0.0 /100 | #294 | Tragic 20.7% |
| Immigrants | Caribbean | 0.0 /100 | #295 | Tragic 20.7% |
| Immigrants | West Indies | 0.0 /100 | #296 | Tragic 20.7% |
| Inupiat | 0.0 /100 | #297 | Tragic 20.8% |