Ottawa vs Apache Receiving Food Stamps
COMPARE
Ottawa
Apache
Receiving Food Stamps
Receiving Food Stamps Comparison
Ottawa
Apache
13.1%
RECEIVING FOOD STAMPS
3.5/ 100
METRIC RATING
229th/ 347
METRIC RANK
18.3%
RECEIVING FOOD STAMPS
0.0/ 100
METRIC RATING
327th/ 347
METRIC RANK
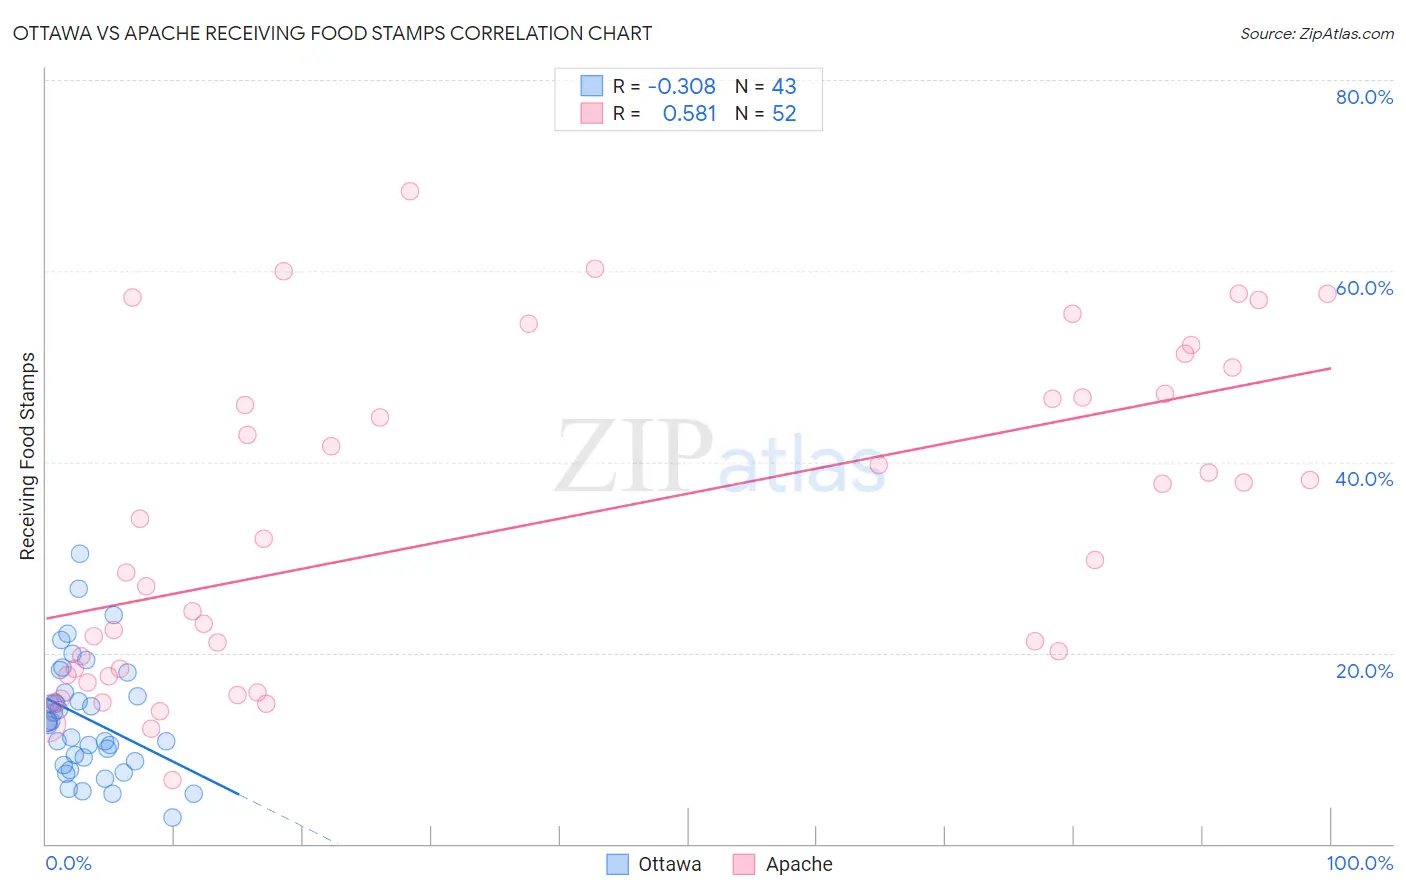
Ottawa vs Apache Receiving Food Stamps Correlation Chart
The statistical analysis conducted on geographies consisting of 49,940,459 people shows a mild negative correlation between the proportion of Ottawa and percentage of population receiving government assistance and/or food stamps in the United States with a correlation coefficient (R) of -0.308 and weighted average of 13.1%. Similarly, the statistical analysis conducted on geographies consisting of 230,963,565 people shows a substantial positive correlation between the proportion of Apache and percentage of population receiving government assistance and/or food stamps in the United States with a correlation coefficient (R) of 0.581 and weighted average of 18.3%, a difference of 39.5%.
Receiving Food Stamps Correlation Summary
| Measurement | Ottawa | Apache |
| Minimum | 2.8% | 6.6% |
| Maximum | 30.4% | 68.4% |
| Range | 27.6% | 61.8% |
| Mean | 13.1% | 33.4% |
| Median | 12.8% | 30.8% |
| Interquartile 25% (IQ1) | 8.7% | 18.0% |
| Interquartile 75% (IQ3) | 15.9% | 47.0% |
| Interquartile Range (IQR) | 7.2% | 29.0% |
| Standard Deviation (Sample) | 6.0% | 16.8% |
| Standard Deviation (Population) | 6.0% | 16.6% |
Similar Demographics by Receiving Food Stamps
Demographics Similar to Ottawa by Receiving Food Stamps
In terms of receiving food stamps, the demographic groups most similar to Ottawa are Panamanian (13.1%, a difference of 0.010%), Nigerian (13.1%, a difference of 0.020%), Puget Sound Salish (13.1%, a difference of 0.050%), Chickasaw (13.1%, a difference of 0.070%), and Immigrants from Nigeria (13.1%, a difference of 0.090%).
| Demographics | Rating | Rank | Receiving Food Stamps |
| Immigrants | Immigrants | 4.4 /100 | #222 | Tragic 13.0% |
| Immigrants | Albania | 4.4 /100 | #223 | Tragic 13.0% |
| Immigrants | Armenia | 4.3 /100 | #224 | Tragic 13.0% |
| Fijians | 4.3 /100 | #225 | Tragic 13.0% |
| Chickasaw | 3.6 /100 | #226 | Tragic 13.1% |
| Nigerians | 3.5 /100 | #227 | Tragic 13.1% |
| Panamanians | 3.5 /100 | #228 | Tragic 13.1% |
| Ottawa | 3.5 /100 | #229 | Tragic 13.1% |
| Puget Sound Salish | 3.4 /100 | #230 | Tragic 13.1% |
| Immigrants | Nigeria | 3.4 /100 | #231 | Tragic 13.1% |
| Salvadorans | 2.7 /100 | #232 | Tragic 13.2% |
| Cherokee | 2.5 /100 | #233 | Tragic 13.2% |
| Comanche | 2.4 /100 | #234 | Tragic 13.3% |
| Immigrants | Zaire | 1.9 /100 | #235 | Tragic 13.4% |
| Crow | 1.6 /100 | #236 | Tragic 13.4% |
Demographics Similar to Apache by Receiving Food Stamps
In terms of receiving food stamps, the demographic groups most similar to Apache are Colville (18.3%, a difference of 0.21%), Cuban (18.2%, a difference of 0.31%), Immigrants from Haiti (18.2%, a difference of 0.42%), Immigrants from Dominica (18.4%, a difference of 0.67%), and British West Indian (17.9%, a difference of 2.2%).
| Demographics | Rating | Rank | Receiving Food Stamps |
| Immigrants | Nicaragua | 0.0 /100 | #320 | Tragic 17.2% |
| Natives/Alaskans | 0.0 /100 | #321 | Tragic 17.3% |
| Immigrants | Grenada | 0.0 /100 | #322 | Tragic 17.8% |
| Haitians | 0.0 /100 | #323 | Tragic 17.8% |
| British West Indians | 0.0 /100 | #324 | Tragic 17.9% |
| Immigrants | Haiti | 0.0 /100 | #325 | Tragic 18.2% |
| Cubans | 0.0 /100 | #326 | Tragic 18.2% |
| Apache | 0.0 /100 | #327 | Tragic 18.3% |
| Colville | 0.0 /100 | #328 | Tragic 18.3% |
| Immigrants | Dominica | 0.0 /100 | #329 | Tragic 18.4% |
| Pima | 0.0 /100 | #330 | Tragic 19.0% |
| Immigrants | Caribbean | 0.0 /100 | #331 | Tragic 19.6% |
| Pueblo | 0.0 /100 | #332 | Tragic 19.9% |
| Inupiat | 0.0 /100 | #333 | Tragic 20.1% |
| Yuman | 0.0 /100 | #334 | Tragic 20.2% |