Immigrants from Liberia vs Apache Receiving Food Stamps
COMPARE
Immigrants from Liberia
Apache
Receiving Food Stamps
Receiving Food Stamps Comparison
Immigrants from Liberia
Apache
15.1%
RECEIVING FOOD STAMPS
0.0/ 100
METRIC RATING
285th/ 347
METRIC RANK
18.3%
RECEIVING FOOD STAMPS
0.0/ 100
METRIC RATING
327th/ 347
METRIC RANK
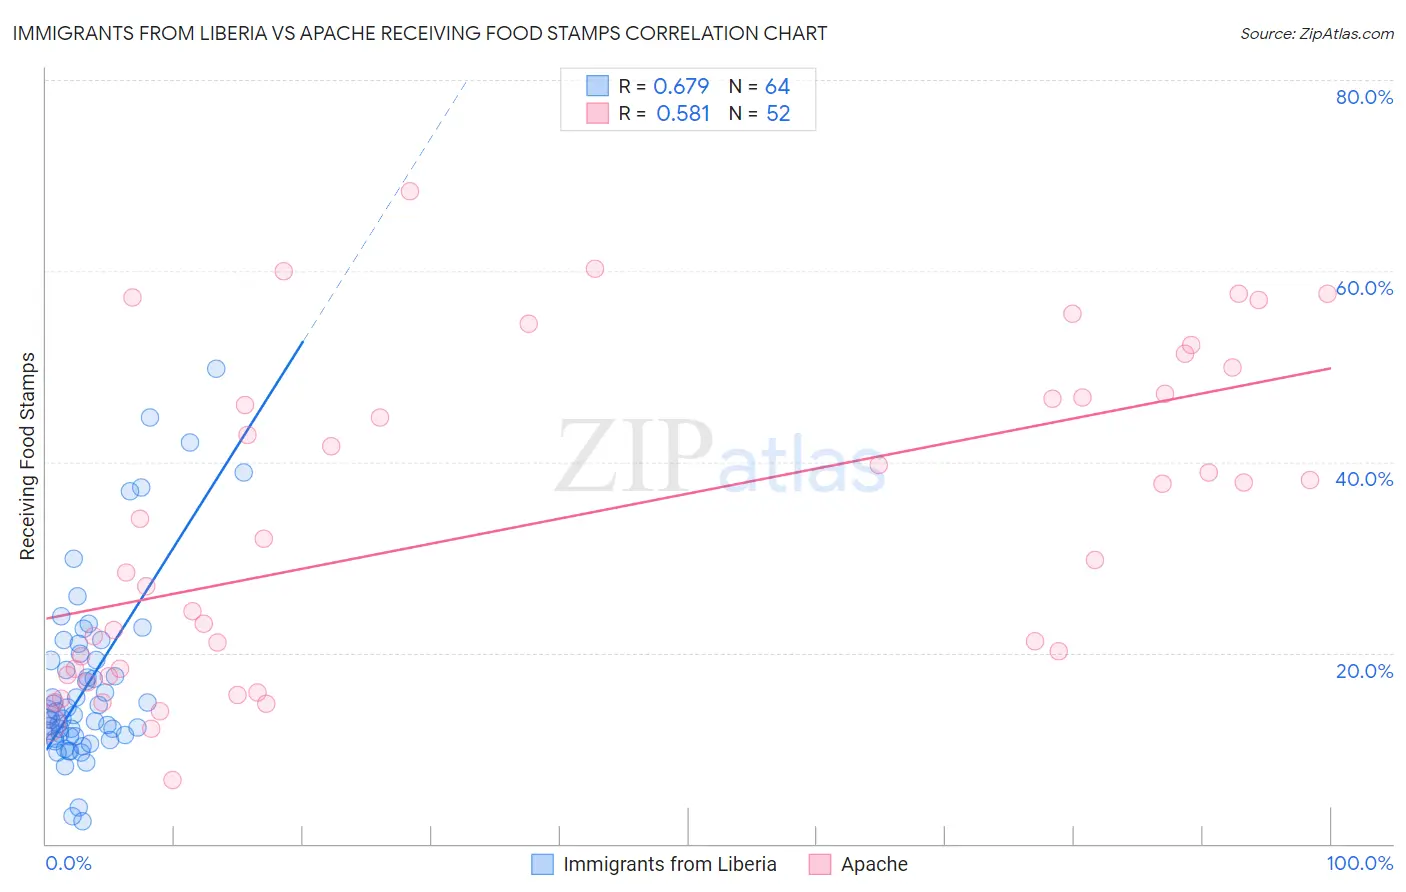
Immigrants from Liberia vs Apache Receiving Food Stamps Correlation Chart
The statistical analysis conducted on geographies consisting of 135,219,591 people shows a significant positive correlation between the proportion of Immigrants from Liberia and percentage of population receiving government assistance and/or food stamps in the United States with a correlation coefficient (R) of 0.679 and weighted average of 15.1%. Similarly, the statistical analysis conducted on geographies consisting of 230,963,565 people shows a substantial positive correlation between the proportion of Apache and percentage of population receiving government assistance and/or food stamps in the United States with a correlation coefficient (R) of 0.581 and weighted average of 18.3%, a difference of 21.0%.
Receiving Food Stamps Correlation Summary
| Measurement | Immigrants from Liberia | Apache |
| Minimum | 2.4% | 6.6% |
| Maximum | 49.8% | 68.4% |
| Range | 47.4% | 61.8% |
| Mean | 16.8% | 33.4% |
| Median | 13.6% | 30.8% |
| Interquartile 25% (IQ1) | 11.3% | 18.0% |
| Interquartile 75% (IQ3) | 19.6% | 47.0% |
| Interquartile Range (IQR) | 8.3% | 29.0% |
| Standard Deviation (Sample) | 9.6% | 16.8% |
| Standard Deviation (Population) | 9.6% | 16.6% |
Similar Demographics by Receiving Food Stamps
Demographics Similar to Immigrants from Liberia by Receiving Food Stamps
In terms of receiving food stamps, the demographic groups most similar to Immigrants from Liberia are African (15.1%, a difference of 0.14%), Immigrants from Mexico (15.2%, a difference of 0.37%), Immigrants from Ecuador (15.0%, a difference of 0.38%), Bangladeshi (15.0%, a difference of 0.39%), and Immigrants from Central America (15.0%, a difference of 0.67%).
| Demographics | Rating | Rank | Receiving Food Stamps |
| Belizeans | 0.1 /100 | #278 | Tragic 14.8% |
| Kiowa | 0.0 /100 | #279 | Tragic 14.9% |
| Ecuadorians | 0.0 /100 | #280 | Tragic 14.9% |
| Spanish American Indians | 0.0 /100 | #281 | Tragic 14.9% |
| Immigrants | Central America | 0.0 /100 | #282 | Tragic 15.0% |
| Bangladeshis | 0.0 /100 | #283 | Tragic 15.0% |
| Immigrants | Ecuador | 0.0 /100 | #284 | Tragic 15.0% |
| Immigrants | Liberia | 0.0 /100 | #285 | Tragic 15.1% |
| Africans | 0.0 /100 | #286 | Tragic 15.1% |
| Immigrants | Mexico | 0.0 /100 | #287 | Tragic 15.2% |
| Immigrants | Belize | 0.0 /100 | #288 | Tragic 15.2% |
| Immigrants | Senegal | 0.0 /100 | #289 | Tragic 15.3% |
| Senegalese | 0.0 /100 | #290 | Tragic 15.4% |
| Hondurans | 0.0 /100 | #291 | Tragic 15.5% |
| Alaska Natives | 0.0 /100 | #292 | Tragic 15.6% |
Demographics Similar to Apache by Receiving Food Stamps
In terms of receiving food stamps, the demographic groups most similar to Apache are Colville (18.3%, a difference of 0.21%), Cuban (18.2%, a difference of 0.31%), Immigrants from Haiti (18.2%, a difference of 0.42%), Immigrants from Dominica (18.4%, a difference of 0.67%), and British West Indian (17.9%, a difference of 2.2%).
| Demographics | Rating | Rank | Receiving Food Stamps |
| Immigrants | Nicaragua | 0.0 /100 | #320 | Tragic 17.2% |
| Natives/Alaskans | 0.0 /100 | #321 | Tragic 17.3% |
| Immigrants | Grenada | 0.0 /100 | #322 | Tragic 17.8% |
| Haitians | 0.0 /100 | #323 | Tragic 17.8% |
| British West Indians | 0.0 /100 | #324 | Tragic 17.9% |
| Immigrants | Haiti | 0.0 /100 | #325 | Tragic 18.2% |
| Cubans | 0.0 /100 | #326 | Tragic 18.2% |
| Apache | 0.0 /100 | #327 | Tragic 18.3% |
| Colville | 0.0 /100 | #328 | Tragic 18.3% |
| Immigrants | Dominica | 0.0 /100 | #329 | Tragic 18.4% |
| Pima | 0.0 /100 | #330 | Tragic 19.0% |
| Immigrants | Caribbean | 0.0 /100 | #331 | Tragic 19.6% |
| Pueblo | 0.0 /100 | #332 | Tragic 19.9% |
| Inupiat | 0.0 /100 | #333 | Tragic 20.1% |
| Yuman | 0.0 /100 | #334 | Tragic 20.2% |