Ottawa vs African Receiving Food Stamps

COMPARE

Ottawa
Race
Ancestry
AfghanAlaska NativeAlaskan AthabascanAlbanianAleutAlsatianAmericanApacheArabArapahoArgentineanArmenianAssyrian/Chaldean/SyriacAustralianAustrianBahamianBangladeshiBarbadianBasqueBelgianBelizeanBermudanBhutaneseBlackfeetBolivianBrazilianBritishBritish West IndianBulgarianBurmeseCajunCambodianCanadianCape VerdeanCarpatho RusynCelticCentral AmericanCentral American IndianCherokeeCheyenneChickasawChileanChineseChippewaChoctawColombianColvilleComancheCosta RicanCreeCreekCroatianCrowCubanCypriotCzechCzechoslovakianDanishDelawareDominicanDutchDutch West IndianEastern EuropeanEcuadorianEgyptianEnglishEstonianEthiopianEuropeanFijianFilipinoFinnishFrenchFrench American IndianFrench CanadianGermanGerman RussianGhanaianGreekGuamanian/ChamorroGuatemalanGuyaneseHaitianHmongHonduranHopiHoumaHungarianIcelanderIndian (Asian)IndonesianInupiatIranianIraqiIrishIroquoisIsraeliItalianJamaicanJapaneseJordanianKenyanKiowaKoreanLaotianLatvianLebaneseLiberianLithuanianLumbeeLuxembourgerMacedonianMalaysianMalteseMarshalleseMenomineeMexicanMexican American IndianMongolianMoroccanNative HawaiianNavajoNepaleseNew ZealanderNicaraguanNigerianNorthern EuropeanNorwegianOkinawanOsageOttawaPaiutePakistaniPalestinianPanamanianParaguayanPennsylvania GermanPeruvianPimaPolishPortuguesePotawatomiPuebloPuerto RicanPuget Sound SalishRomanianRussianSalvadoranSamoanScandinavianScotch-IrishScottishSeminoleSenegaleseSerbianShoshoneSierra LeoneanSiouxSlavicSlovakSloveneSomaliSouth AfricanSouth AmericanSouth American IndianSoviet UnionSpaniardSpanishSpanish AmericanSpanish American IndianSri LankanSubsaharan AfricanSudaneseSwedishSwissSyrianTaiwaneseThaiTlingit-HaidaTohono O'OdhamTonganTrinidadian and TobagonianTsimshianTurkishU.S. Virgin IslanderUgandanUkrainianUruguayanUteVenezuelanVietnameseWelshWest IndianYakamaYaquiYugoslavianYumanYup'ikZimbabwean
Immigration
NonimmigrantsImmigrantsAfghanistanAfricaAlbaniaArgentinaArmeniaAsiaAustraliaAustriaBahamasBangladeshBarbadosBelarusBelgiumBelizeBoliviaBosnia and HerzegovinaBrazilBulgariaBurma/MyanmarCabo VerdeCambodiaCameroonCanadaCaribbeanCentral AmericaChileChinaColombiaCongoCosta RicaCroatiaCubaCzechoslovakiaDenmarkDominicaDominican RepublicEastern AfricaEastern AsiaEastern EuropeEcuadorEgyptEl SalvadorEnglandEritreaEthiopiaEuropeFijiFranceGermanyGhanaGreeceGrenadaGuatemalaGuyanaHaitiHondurasHong KongHungaryIndiaIndonesiaIranIraqIrelandIsraelItalyJamaicaJapanJordanKazakhstanKenyaKoreaKuwaitLaosLatin AmericaLatviaLebanonLiberiaLithuaniaMalaysiaMexicoMicronesiaMiddle AfricaMoldovaMoroccoNepalNetherlandsNicaraguaNigeriaNorth AmericaNorth MacedoniaNorthern AfricaNorthern EuropeNorwayOceaniaPakistanPanamaPeruPhilippinesPolandPortugalRomaniaRussiaSaudi ArabiaScotlandSenegalSerbiaSierra LeoneSingaporeSomaliaSouth AfricaSouth AmericaSouth Central AsiaSouth Eastern AsiaSouthern EuropeSpainSri LankaSt. Vincent and the GrenadinesSudanSwedenSwitzerlandSyriaTaiwanThailandTrinidad and TobagoTurkeyUgandaUkraineUruguayUzbekistanVenezuelaVietnamWest IndiesWestern AfricaWestern AsiaWestern EuropeYemenZaireZimbabweAzores
African
Race
Ancestry
AfghanAfricanAlaska NativeAlaskan AthabascanAlbanianAleutAlsatianAmericanApacheArabArapahoArgentineanArmenianAssyrian/Chaldean/SyriacAustralianAustrianBahamianBangladeshiBarbadianBasqueBelgianBelizeanBermudanBhutaneseBlackfeetBolivianBrazilianBritishBritish West IndianBulgarianBurmeseCajunCambodianCanadianCape VerdeanCarpatho RusynCelticCentral AmericanCentral American IndianCherokeeCheyenneChickasawChileanChineseChippewaChoctawColombianColvilleComancheCosta RicanCreeCreekCroatianCrowCubanCypriotCzechCzechoslovakianDanishDelawareDominicanDutchDutch West IndianEastern EuropeanEcuadorianEgyptianEnglishEstonianEthiopianEuropeanFijianFilipinoFinnishFrenchFrench American IndianFrench CanadianGermanGerman RussianGhanaianGreekGuamanian/ChamorroGuatemalanGuyaneseHaitianHmongHonduranHopiHoumaHungarianIcelanderIndian (Asian)IndonesianInupiatIranianIraqiIrishIroquoisIsraeliItalianJamaicanJapaneseJordanianKenyanKiowaKoreanLaotianLatvianLebaneseLiberianLithuanianLumbeeLuxembourgerMacedonianMalaysianMalteseMarshalleseMenomineeMexicanMexican American IndianMongolianMoroccanNative HawaiianNavajoNepaleseNew ZealanderNicaraguanNigerianNorthern EuropeanNorwegianOkinawanOsagePaiutePakistaniPalestinianPanamanianParaguayanPennsylvania GermanPeruvianPimaPolishPortuguesePotawatomiPuebloPuerto RicanPuget Sound SalishRomanianRussianSalvadoranSamoanScandinavianScotch-IrishScottishSeminoleSenegaleseSerbianShoshoneSierra LeoneanSiouxSlavicSlovakSloveneSomaliSouth AfricanSouth AmericanSouth American IndianSoviet UnionSpaniardSpanishSpanish AmericanSpanish American IndianSri LankanSubsaharan AfricanSudaneseSwedishSwissSyrianTaiwaneseThaiTlingit-HaidaTohono O'OdhamTonganTrinidadian and TobagonianTsimshianTurkishU.S. Virgin IslanderUgandanUkrainianUruguayanUteVenezuelanVietnameseWelshWest IndianYakamaYaquiYugoslavianYumanYup'ikZimbabwean
Immigration
NonimmigrantsImmigrantsAfghanistanAfricaAlbaniaArgentinaArmeniaAsiaAustraliaAustriaBahamasBangladeshBarbadosBelarusBelgiumBelizeBoliviaBosnia and HerzegovinaBrazilBulgariaBurma/MyanmarCabo VerdeCambodiaCameroonCanadaCaribbeanCentral AmericaChileChinaColombiaCongoCosta RicaCroatiaCubaCzechoslovakiaDenmarkDominicaDominican RepublicEastern AfricaEastern AsiaEastern EuropeEcuadorEgyptEl SalvadorEnglandEritreaEthiopiaEuropeFijiFranceGermanyGhanaGreeceGrenadaGuatemalaGuyanaHaitiHondurasHong KongHungaryIndiaIndonesiaIranIraqIrelandIsraelItalyJamaicaJapanJordanKazakhstanKenyaKoreaKuwaitLaosLatin AmericaLatviaLebanonLiberiaLithuaniaMalaysiaMexicoMicronesiaMiddle AfricaMoldovaMoroccoNepalNetherlandsNicaraguaNigeriaNorth AmericaNorth MacedoniaNorthern AfricaNorthern EuropeNorwayOceaniaPakistanPanamaPeruPhilippinesPolandPortugalRomaniaRussiaSaudi ArabiaScotlandSenegalSerbiaSierra LeoneSingaporeSomaliaSouth AfricaSouth AmericaSouth Central AsiaSouth Eastern AsiaSouthern EuropeSpainSri LankaSt. Vincent and the GrenadinesSudanSwedenSwitzerlandSyriaTaiwanThailandTrinidad and TobagoTurkeyUgandaUkraineUruguayUzbekistanVenezuelaVietnamWest IndiesWestern AfricaWestern AsiaWestern EuropeYemenZaireZimbabweAzores
Receiving Food Stamps
Income
Poverty
Unemployment
Labor Participation
Family Structure
Vehicle Availability
Education Level
Disability

Receiving Food Stamps Comparison

Ottawa

Africans

Tragic
Tragic
13.1%
RECEIVING FOOD STAMPS
3.5/ 100
METRIC RATING
229th/ 347
METRIC RANK
15.1%
RECEIVING FOOD STAMPS
0.0/ 100
METRIC RATING
286th/ 347
METRIC RANK

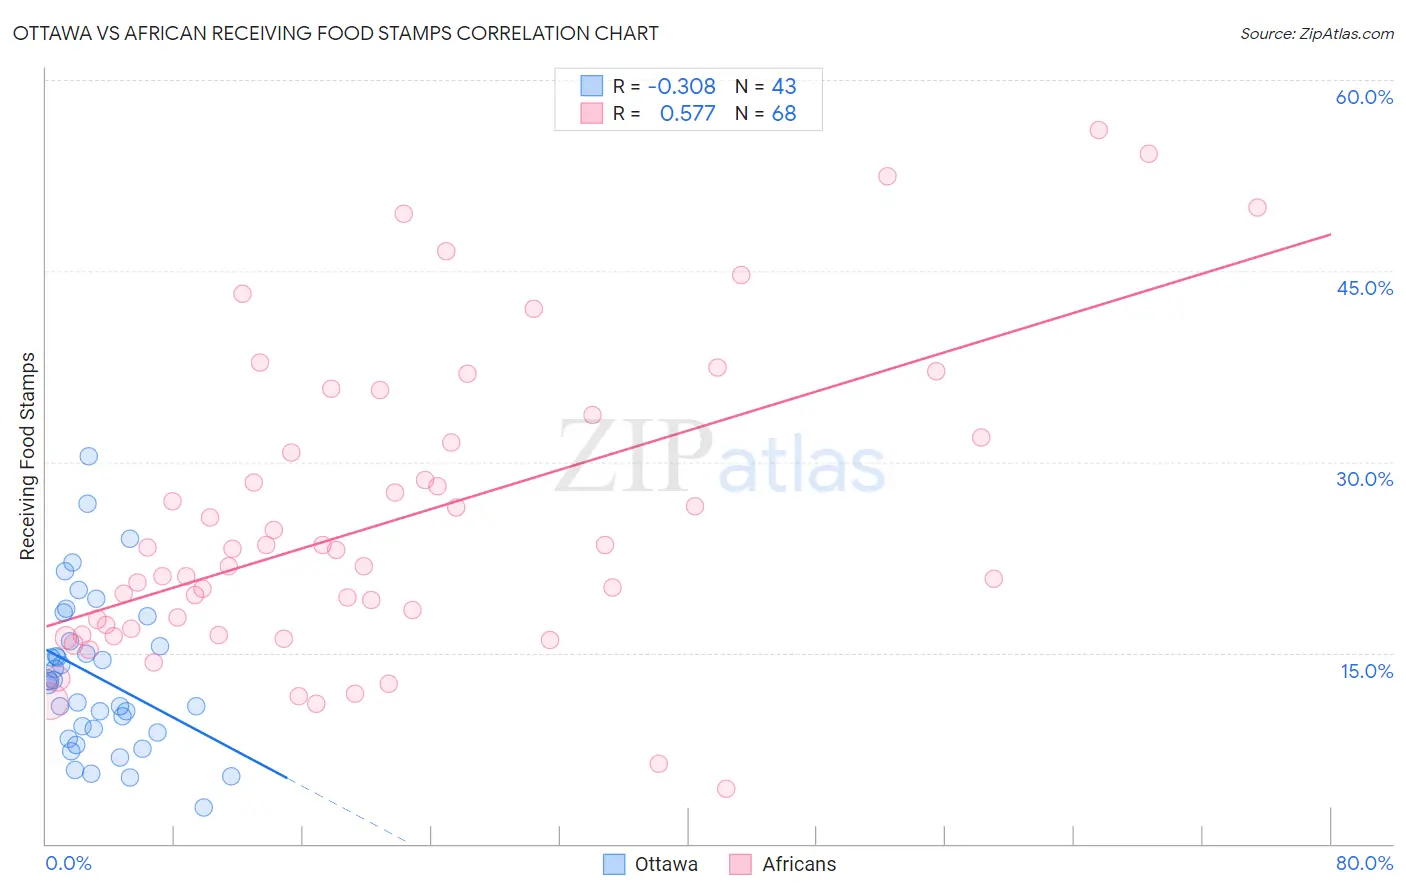
Ottawa vs African Receiving Food Stamps Correlation Chart

The statistical analysis conducted on geographies consisting of 49,940,459 people shows a mild negative correlation between the proportion of Ottawa and percentage of population receiving government assistance and/or food stamps in the United States with a correlation coefficient (R) of -0.308 and weighted average of 13.1%. Similarly, the statistical analysis conducted on geographies consisting of 468,859,101 people shows a substantial positive correlation between the proportion of Africans and percentage of population receiving government assistance and/or food stamps in the United States with a correlation coefficient (R) of 0.577 and weighted average of 15.1%, a difference of 15.4%.
Ottawa vs African Receiving Food Stamps

Receiving Food Stamps Correlation Summary

MeasurementOttawaAfrican
Minimum2.8%4.3%
Maximum30.4%56.1%
Range27.6%51.8%
Mean13.1%25.4%
Median12.8%22.5%
Interquartile 25% (IQ1)8.7%16.6%
Interquartile 75% (IQ3)15.9%31.7%
Interquartile Range (IQR)7.2%15.1%
Standard Deviation (Sample)6.0%11.9%
Standard Deviation (Population)6.0%11.8%

Similar Demographics by Receiving Food Stamps

Demographics Similar to Ottawa by Receiving Food Stamps

In terms of receiving food stamps, the demographic groups most similar to Ottawa are Panamanian (13.1%, a difference of 0.010%), Nigerian (13.1%, a difference of 0.020%), Puget Sound Salish (13.1%, a difference of 0.050%), Chickasaw (13.1%, a difference of 0.070%), and Immigrants from Nigeria (13.1%, a difference of 0.090%).
DemographicsRating | RankReceiving Food Stamps
Immigrants | Immigrants
4.4
/100
|
#222
Tragic
13.0%
Immigrants | Albania
4.4
/100
|
#223
Tragic
13.0%
Immigrants | Armenia
4.3
/100
|
#224
Tragic
13.0%
Fijians
4.3
/100
|
#225
Tragic
13.0%
Chickasaw
3.6
/100
|
#226
Tragic
13.1%
Nigerians
3.5
/100
|
#227
Tragic
13.1%
Panamanians
3.5
/100
|
#228
Tragic
13.1%
Ottawa
3.5
/100
|
#229
Tragic
13.1%
Puget Sound Salish
3.4
/100
|
#230
Tragic
13.1%
Immigrants | Nigeria
3.4
/100
|
#231
Tragic
13.1%
Salvadorans
2.7
/100
|
#232
Tragic
13.2%
Cherokee
2.5
/100
|
#233
Tragic
13.2%
Comanche
2.4
/100
|
#234
Tragic
13.3%
Immigrants | Zaire
1.9
/100
|
#235
Tragic
13.4%
Crow
1.6
/100
|
#236
Tragic
13.4%

Demographics Similar to Africans by Receiving Food Stamps

In terms of receiving food stamps, the demographic groups most similar to Africans are Immigrants from Liberia (15.1%, a difference of 0.14%), Immigrants from Mexico (15.2%, a difference of 0.23%), Immigrants from Ecuador (15.0%, a difference of 0.52%), Bangladeshi (15.0%, a difference of 0.53%), and Immigrants from Belize (15.2%, a difference of 0.69%).
DemographicsRating | RankReceiving Food Stamps
Kiowa
0.0
/100
|
#279
Tragic
14.9%
Ecuadorians
0.0
/100
|
#280
Tragic
14.9%
Spanish American Indians
0.0
/100
|
#281
Tragic
14.9%
Immigrants | Central America
0.0
/100
|
#282
Tragic
15.0%
Bangladeshis
0.0
/100
|
#283
Tragic
15.0%
Immigrants | Ecuador
0.0
/100
|
#284
Tragic
15.0%
Immigrants | Liberia
0.0
/100
|
#285
Tragic
15.1%
Africans
0.0
/100
|
#286
Tragic
15.1%
Immigrants | Mexico
0.0
/100
|
#287
Tragic
15.2%
Immigrants | Belize
0.0
/100
|
#288
Tragic
15.2%
Immigrants | Senegal
0.0
/100
|
#289
Tragic
15.3%
Senegalese
0.0
/100
|
#290
Tragic
15.4%
Hondurans
0.0
/100
|
#291
Tragic
15.5%
Alaska Natives
0.0
/100
|
#292
Tragic
15.6%
Vietnamese
0.0
/100
|
#293
Tragic
15.7%