Ottawa vs Slovak Receiving Food Stamps
COMPARE
Ottawa
Slovak
Receiving Food Stamps
Receiving Food Stamps Comparison
Ottawa
Slovaks
13.1%
RECEIVING FOOD STAMPS
3.5/ 100
METRIC RATING
229th/ 347
METRIC RANK
10.8%
RECEIVING FOOD STAMPS
89.8/ 100
METRIC RATING
136th/ 347
METRIC RANK
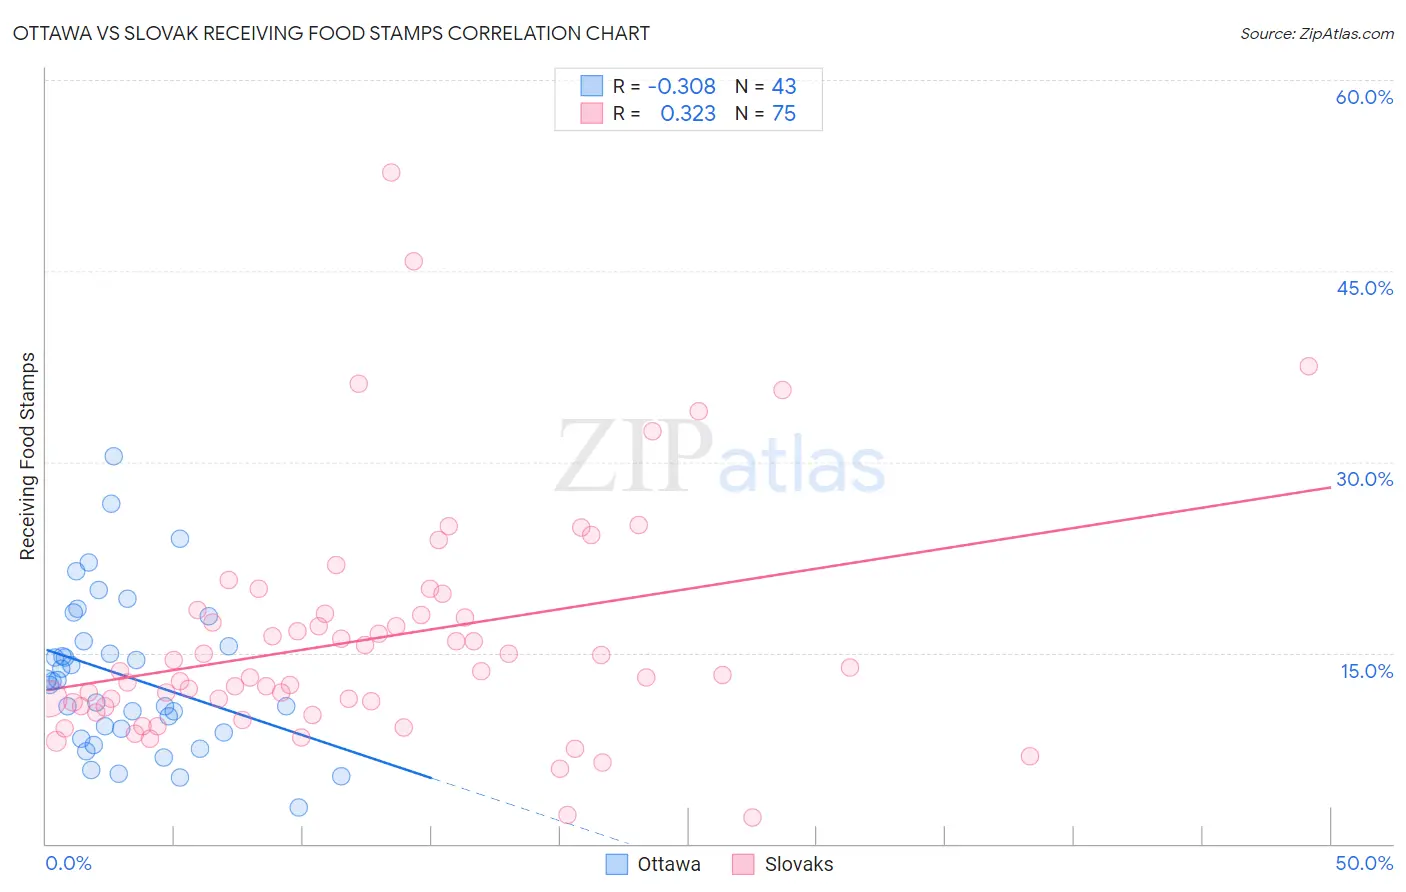
Ottawa vs Slovak Receiving Food Stamps Correlation Chart
The statistical analysis conducted on geographies consisting of 49,940,459 people shows a mild negative correlation between the proportion of Ottawa and percentage of population receiving government assistance and/or food stamps in the United States with a correlation coefficient (R) of -0.308 and weighted average of 13.1%. Similarly, the statistical analysis conducted on geographies consisting of 396,487,811 people shows a mild positive correlation between the proportion of Slovaks and percentage of population receiving government assistance and/or food stamps in the United States with a correlation coefficient (R) of 0.323 and weighted average of 10.8%, a difference of 20.8%.
Receiving Food Stamps Correlation Summary
| Measurement | Ottawa | Slovak |
| Minimum | 2.8% | 2.1% |
| Maximum | 30.4% | 52.7% |
| Range | 27.6% | 50.6% |
| Mean | 13.1% | 16.1% |
| Median | 12.8% | 13.5% |
| Interquartile 25% (IQ1) | 8.7% | 10.8% |
| Interquartile 75% (IQ3) | 15.9% | 18.0% |
| Interquartile Range (IQR) | 7.2% | 7.2% |
| Standard Deviation (Sample) | 6.0% | 9.1% |
| Standard Deviation (Population) | 6.0% | 9.1% |
Similar Demographics by Receiving Food Stamps
Demographics Similar to Ottawa by Receiving Food Stamps
In terms of receiving food stamps, the demographic groups most similar to Ottawa are Panamanian (13.1%, a difference of 0.010%), Nigerian (13.1%, a difference of 0.020%), Puget Sound Salish (13.1%, a difference of 0.050%), Chickasaw (13.1%, a difference of 0.070%), and Immigrants from Nigeria (13.1%, a difference of 0.090%).
| Demographics | Rating | Rank | Receiving Food Stamps |
| Immigrants | Immigrants | 4.4 /100 | #222 | Tragic 13.0% |
| Immigrants | Albania | 4.4 /100 | #223 | Tragic 13.0% |
| Immigrants | Armenia | 4.3 /100 | #224 | Tragic 13.0% |
| Fijians | 4.3 /100 | #225 | Tragic 13.0% |
| Chickasaw | 3.6 /100 | #226 | Tragic 13.1% |
| Nigerians | 3.5 /100 | #227 | Tragic 13.1% |
| Panamanians | 3.5 /100 | #228 | Tragic 13.1% |
| Ottawa | 3.5 /100 | #229 | Tragic 13.1% |
| Puget Sound Salish | 3.4 /100 | #230 | Tragic 13.1% |
| Immigrants | Nigeria | 3.4 /100 | #231 | Tragic 13.1% |
| Salvadorans | 2.7 /100 | #232 | Tragic 13.2% |
| Cherokee | 2.5 /100 | #233 | Tragic 13.2% |
| Comanche | 2.4 /100 | #234 | Tragic 13.3% |
| Immigrants | Zaire | 1.9 /100 | #235 | Tragic 13.4% |
| Crow | 1.6 /100 | #236 | Tragic 13.4% |
Demographics Similar to Slovaks by Receiving Food Stamps
In terms of receiving food stamps, the demographic groups most similar to Slovaks are Immigrants from Eastern Europe (10.8%, a difference of 0.020%), Argentinean (10.8%, a difference of 0.17%), Immigrants from Brazil (10.8%, a difference of 0.19%), Immigrants from Russia (10.8%, a difference of 0.49%), and Immigrants from Moldova (10.9%, a difference of 0.53%).
| Demographics | Rating | Rank | Receiving Food Stamps |
| Yugoslavians | 92.5 /100 | #129 | Exceptional 10.7% |
| Israelis | 92.4 /100 | #130 | Exceptional 10.7% |
| French | 92.3 /100 | #131 | Exceptional 10.7% |
| Immigrants | Germany | 92.0 /100 | #132 | Exceptional 10.7% |
| Immigrants | Russia | 90.9 /100 | #133 | Exceptional 10.8% |
| Immigrants | Brazil | 90.3 /100 | #134 | Exceptional 10.8% |
| Argentineans | 90.2 /100 | #135 | Exceptional 10.8% |
| Slovaks | 89.8 /100 | #136 | Excellent 10.8% |
| Immigrants | Eastern Europe | 89.8 /100 | #137 | Excellent 10.8% |
| Immigrants | Moldova | 88.5 /100 | #138 | Excellent 10.9% |
| Hmong | 88.4 /100 | #139 | Excellent 10.9% |
| Celtics | 87.8 /100 | #140 | Excellent 10.9% |
| Immigrants | Vietnam | 86.7 /100 | #141 | Excellent 11.0% |
| Chileans | 86.2 /100 | #142 | Excellent 11.0% |
| Immigrants | Northern Africa | 86.0 /100 | #143 | Excellent 11.0% |