Ottawa vs Nepalese Receiving Food Stamps
COMPARE
Ottawa
Nepalese
Receiving Food Stamps
Receiving Food Stamps Comparison
Ottawa
Nepalese
13.1%
RECEIVING FOOD STAMPS
3.5/ 100
METRIC RATING
229th/ 347
METRIC RANK
14.6%
RECEIVING FOOD STAMPS
0.1/ 100
METRIC RATING
269th/ 347
METRIC RANK
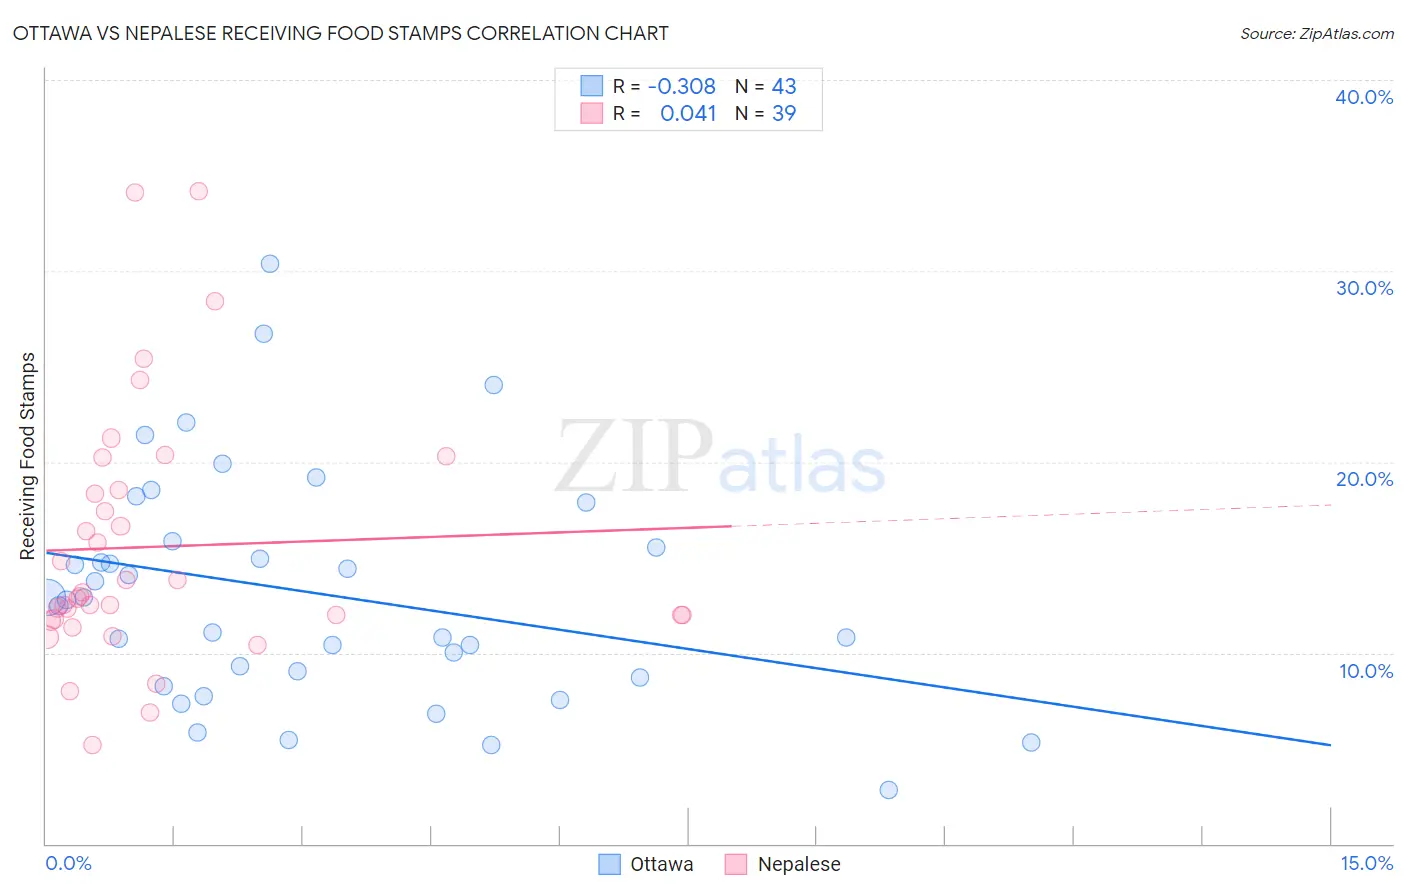
Ottawa vs Nepalese Receiving Food Stamps Correlation Chart
The statistical analysis conducted on geographies consisting of 49,940,459 people shows a mild negative correlation between the proportion of Ottawa and percentage of population receiving government assistance and/or food stamps in the United States with a correlation coefficient (R) of -0.308 and weighted average of 13.1%. Similarly, the statistical analysis conducted on geographies consisting of 24,519,269 people shows no correlation between the proportion of Nepalese and percentage of population receiving government assistance and/or food stamps in the United States with a correlation coefficient (R) of 0.041 and weighted average of 14.6%, a difference of 11.5%.
Receiving Food Stamps Correlation Summary
| Measurement | Ottawa | Nepalese |
| Minimum | 2.8% | 5.2% |
| Maximum | 30.4% | 34.2% |
| Range | 27.6% | 29.0% |
| Mean | 13.1% | 15.6% |
| Median | 12.8% | 13.0% |
| Interquartile 25% (IQ1) | 8.7% | 11.8% |
| Interquartile 75% (IQ3) | 15.9% | 18.5% |
| Interquartile Range (IQR) | 7.2% | 6.8% |
| Standard Deviation (Sample) | 6.0% | 6.6% |
| Standard Deviation (Population) | 6.0% | 6.6% |
Similar Demographics by Receiving Food Stamps
Demographics Similar to Ottawa by Receiving Food Stamps
In terms of receiving food stamps, the demographic groups most similar to Ottawa are Panamanian (13.1%, a difference of 0.010%), Nigerian (13.1%, a difference of 0.020%), Puget Sound Salish (13.1%, a difference of 0.050%), Chickasaw (13.1%, a difference of 0.070%), and Immigrants from Nigeria (13.1%, a difference of 0.090%).
| Demographics | Rating | Rank | Receiving Food Stamps |
| Immigrants | Immigrants | 4.4 /100 | #222 | Tragic 13.0% |
| Immigrants | Albania | 4.4 /100 | #223 | Tragic 13.0% |
| Immigrants | Armenia | 4.3 /100 | #224 | Tragic 13.0% |
| Fijians | 4.3 /100 | #225 | Tragic 13.0% |
| Chickasaw | 3.6 /100 | #226 | Tragic 13.1% |
| Nigerians | 3.5 /100 | #227 | Tragic 13.1% |
| Panamanians | 3.5 /100 | #228 | Tragic 13.1% |
| Ottawa | 3.5 /100 | #229 | Tragic 13.1% |
| Puget Sound Salish | 3.4 /100 | #230 | Tragic 13.1% |
| Immigrants | Nigeria | 3.4 /100 | #231 | Tragic 13.1% |
| Salvadorans | 2.7 /100 | #232 | Tragic 13.2% |
| Cherokee | 2.5 /100 | #233 | Tragic 13.2% |
| Comanche | 2.4 /100 | #234 | Tragic 13.3% |
| Immigrants | Zaire | 1.9 /100 | #235 | Tragic 13.4% |
| Crow | 1.6 /100 | #236 | Tragic 13.4% |
Demographics Similar to Nepalese by Receiving Food Stamps
In terms of receiving food stamps, the demographic groups most similar to Nepalese are Mexican (14.6%, a difference of 0.20%), Immigrants from Guatemala (14.6%, a difference of 0.30%), Chippewa (14.7%, a difference of 0.52%), Alaskan Athabascan (14.7%, a difference of 0.55%), and Immigrants from Western Africa (14.7%, a difference of 0.57%).
| Demographics | Rating | Rank | Receiving Food Stamps |
| Paiute | 0.2 /100 | #262 | Tragic 14.3% |
| Immigrants | Portugal | 0.2 /100 | #263 | Tragic 14.3% |
| Immigrants | Uzbekistan | 0.2 /100 | #264 | Tragic 14.3% |
| Blackfeet | 0.2 /100 | #265 | Tragic 14.3% |
| Cheyenne | 0.2 /100 | #266 | Tragic 14.3% |
| Dutch West Indians | 0.2 /100 | #267 | Tragic 14.3% |
| Guatemalans | 0.1 /100 | #268 | Tragic 14.4% |
| Nepalese | 0.1 /100 | #269 | Tragic 14.6% |
| Mexicans | 0.1 /100 | #270 | Tragic 14.6% |
| Immigrants | Guatemala | 0.1 /100 | #271 | Tragic 14.6% |
| Chippewa | 0.1 /100 | #272 | Tragic 14.7% |
| Alaskan Athabascans | 0.1 /100 | #273 | Tragic 14.7% |
| Immigrants | Western Africa | 0.1 /100 | #274 | Tragic 14.7% |
| Ute | 0.1 /100 | #275 | Tragic 14.7% |
| Liberians | 0.1 /100 | #276 | Tragic 14.8% |