Ottawa vs Immigrants from Dominican Republic Receiving Food Stamps
COMPARE
Ottawa
Immigrants from Dominican Republic
Receiving Food Stamps
Receiving Food Stamps Comparison
Ottawa
Immigrants from Dominican Republic
13.1%
RECEIVING FOOD STAMPS
3.5/ 100
METRIC RATING
229th/ 347
METRIC RANK
22.1%
RECEIVING FOOD STAMPS
0.0/ 100
METRIC RATING
343rd/ 347
METRIC RANK
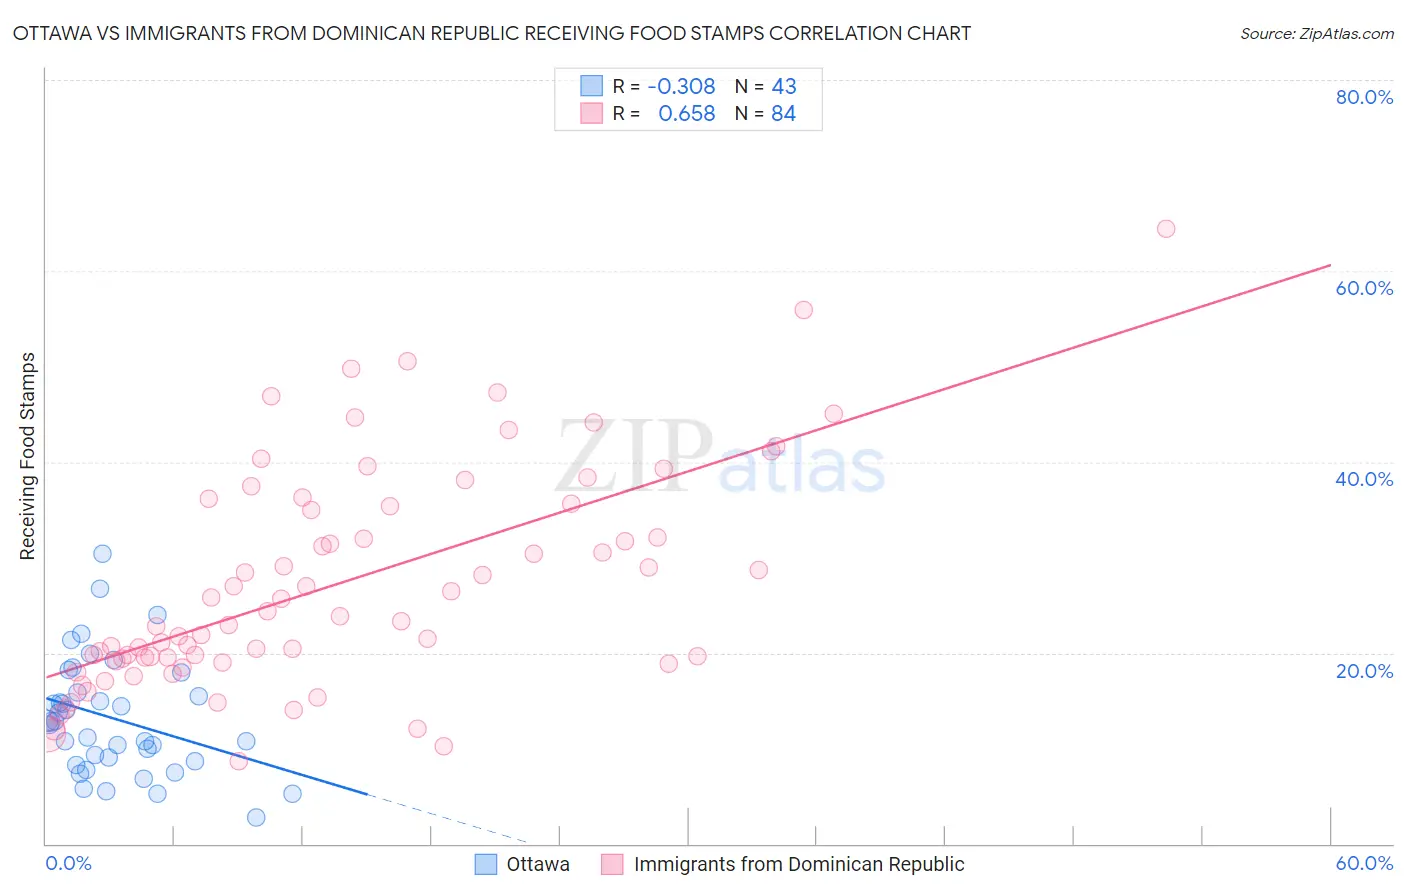
Ottawa vs Immigrants from Dominican Republic Receiving Food Stamps Correlation Chart
The statistical analysis conducted on geographies consisting of 49,940,459 people shows a mild negative correlation between the proportion of Ottawa and percentage of population receiving government assistance and/or food stamps in the United States with a correlation coefficient (R) of -0.308 and weighted average of 13.1%. Similarly, the statistical analysis conducted on geographies consisting of 274,487,566 people shows a significant positive correlation between the proportion of Immigrants from Dominican Republic and percentage of population receiving government assistance and/or food stamps in the United States with a correlation coefficient (R) of 0.658 and weighted average of 22.1%, a difference of 68.9%.
Receiving Food Stamps Correlation Summary
| Measurement | Ottawa | Immigrants from Dominican Republic |
| Minimum | 2.8% | 8.7% |
| Maximum | 30.4% | 64.4% |
| Range | 27.6% | 55.7% |
| Mean | 13.1% | 27.2% |
| Median | 12.8% | 23.6% |
| Interquartile 25% (IQ1) | 8.7% | 19.3% |
| Interquartile 75% (IQ3) | 15.9% | 35.5% |
| Interquartile Range (IQR) | 7.2% | 16.2% |
| Standard Deviation (Sample) | 6.0% | 11.5% |
| Standard Deviation (Population) | 6.0% | 11.5% |
Similar Demographics by Receiving Food Stamps
Demographics Similar to Ottawa by Receiving Food Stamps
In terms of receiving food stamps, the demographic groups most similar to Ottawa are Panamanian (13.1%, a difference of 0.010%), Nigerian (13.1%, a difference of 0.020%), Puget Sound Salish (13.1%, a difference of 0.050%), Chickasaw (13.1%, a difference of 0.070%), and Immigrants from Nigeria (13.1%, a difference of 0.090%).
| Demographics | Rating | Rank | Receiving Food Stamps |
| Immigrants | Immigrants | 4.4 /100 | #222 | Tragic 13.0% |
| Immigrants | Albania | 4.4 /100 | #223 | Tragic 13.0% |
| Immigrants | Armenia | 4.3 /100 | #224 | Tragic 13.0% |
| Fijians | 4.3 /100 | #225 | Tragic 13.0% |
| Chickasaw | 3.6 /100 | #226 | Tragic 13.1% |
| Nigerians | 3.5 /100 | #227 | Tragic 13.1% |
| Panamanians | 3.5 /100 | #228 | Tragic 13.1% |
| Ottawa | 3.5 /100 | #229 | Tragic 13.1% |
| Puget Sound Salish | 3.4 /100 | #230 | Tragic 13.1% |
| Immigrants | Nigeria | 3.4 /100 | #231 | Tragic 13.1% |
| Salvadorans | 2.7 /100 | #232 | Tragic 13.2% |
| Cherokee | 2.5 /100 | #233 | Tragic 13.2% |
| Comanche | 2.4 /100 | #234 | Tragic 13.3% |
| Immigrants | Zaire | 1.9 /100 | #235 | Tragic 13.4% |
| Crow | 1.6 /100 | #236 | Tragic 13.4% |
Demographics Similar to Immigrants from Dominican Republic by Receiving Food Stamps
In terms of receiving food stamps, the demographic groups most similar to Immigrants from Dominican Republic are Immigrants from Yemen (21.6%, a difference of 2.2%), Hopi (21.6%, a difference of 2.7%), Tohono O'odham (21.5%, a difference of 3.0%), Yakama (21.4%, a difference of 3.3%), and Dominican (21.4%, a difference of 3.6%).
| Demographics | Rating | Rank | Receiving Food Stamps |
| Inupiat | 0.0 /100 | #333 | Tragic 20.1% |
| Yuman | 0.0 /100 | #334 | Tragic 20.2% |
| Immigrants | Cuba | 0.0 /100 | #335 | Tragic 20.8% |
| Navajo | 0.0 /100 | #336 | Tragic 21.1% |
| Cape Verdeans | 0.0 /100 | #337 | Tragic 21.1% |
| Dominicans | 0.0 /100 | #338 | Tragic 21.4% |
| Yakama | 0.0 /100 | #339 | Tragic 21.4% |
| Tohono O'odham | 0.0 /100 | #340 | Tragic 21.5% |
| Hopi | 0.0 /100 | #341 | Tragic 21.6% |
| Immigrants | Yemen | 0.0 /100 | #342 | Tragic 21.6% |
| Immigrants | Dominican Republic | 0.0 /100 | #343 | Tragic 22.1% |
| Lumbee | 0.0 /100 | #344 | Tragic 22.9% |
| Immigrants | Cabo Verde | 0.0 /100 | #345 | Tragic 23.8% |
| Puerto Ricans | 0.0 /100 | #346 | Tragic 26.0% |
| Yup'ik | 0.0 /100 | #347 | Tragic 32.7% |