Ottawa vs Apache Child Poverty Under the Age of 5
COMPARE
Ottawa
Apache
Child Poverty Under the Age of 5
Child Poverty Under the Age of 5 Comparison
Ottawa
Apache
20.3%
CHILD POVERTY UNDER THE AGE OF 5
0.1/ 100
METRIC RATING
267th/ 347
METRIC RANK
25.0%
CHILD POVERTY UNDER THE AGE OF 5
0.0/ 100
METRIC RATING
332nd/ 347
METRIC RANK
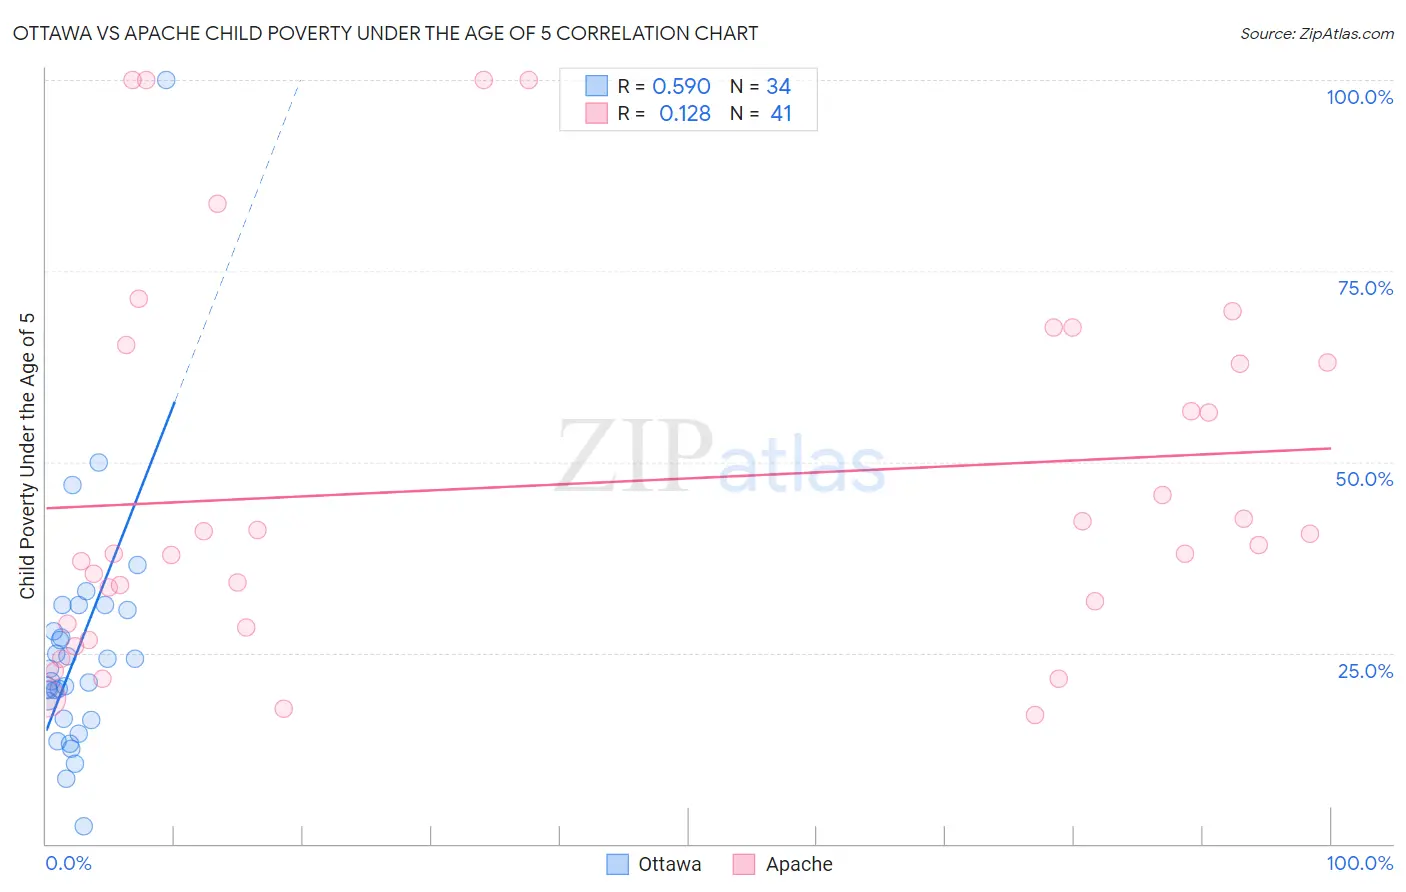
Ottawa vs Apache Child Poverty Under the Age of 5 Correlation Chart
The statistical analysis conducted on geographies consisting of 49,352,699 people shows a substantial positive correlation between the proportion of Ottawa and poverty level among children under the age of 5 in the United States with a correlation coefficient (R) of 0.590 and weighted average of 20.3%. Similarly, the statistical analysis conducted on geographies consisting of 227,703,796 people shows a poor positive correlation between the proportion of Apache and poverty level among children under the age of 5 in the United States with a correlation coefficient (R) of 0.128 and weighted average of 25.0%, a difference of 22.9%.
Child Poverty Under the Age of 5 Correlation Summary
| Measurement | Ottawa | Apache |
| Minimum | 2.3% | 16.9% |
| Maximum | 100.0% | 100.0% |
| Range | 97.7% | 83.1% |
| Mean | 25.4% | 47.1% |
| Median | 22.1% | 39.2% |
| Interquartile 25% (IQ1) | 16.4% | 28.6% |
| Interquartile 75% (IQ3) | 30.6% | 64.1% |
| Interquartile Range (IQR) | 14.2% | 35.5% |
| Standard Deviation (Sample) | 16.5% | 24.2% |
| Standard Deviation (Population) | 16.2% | 23.9% |
Similar Demographics by Child Poverty Under the Age of 5
Demographics Similar to Ottawa by Child Poverty Under the Age of 5
In terms of child poverty under the age of 5, the demographic groups most similar to Ottawa are Belizean (20.3%, a difference of 0.0%), Immigrants from Burma/Myanmar (20.4%, a difference of 0.090%), Jamaican (20.4%, a difference of 0.16%), Aleut (20.3%, a difference of 0.39%), and Spanish American Indian (20.2%, a difference of 0.52%).
| Demographics | Rating | Rank | Child Poverty Under the Age of 5 |
| Spanish Americans | 0.2 /100 | #260 | Tragic 20.1% |
| Immigrants | Bangladesh | 0.2 /100 | #261 | Tragic 20.1% |
| Liberians | 0.1 /100 | #262 | Tragic 20.2% |
| Barbadians | 0.1 /100 | #263 | Tragic 20.2% |
| Immigrants | Liberia | 0.1 /100 | #264 | Tragic 20.2% |
| Spanish American Indians | 0.1 /100 | #265 | Tragic 20.2% |
| Aleuts | 0.1 /100 | #266 | Tragic 20.3% |
| Ottawa | 0.1 /100 | #267 | Tragic 20.3% |
| Belizeans | 0.1 /100 | #268 | Tragic 20.3% |
| Immigrants | Burma/Myanmar | 0.1 /100 | #269 | Tragic 20.4% |
| Jamaicans | 0.1 /100 | #270 | Tragic 20.4% |
| Americans | 0.1 /100 | #271 | Tragic 20.5% |
| Immigrants | Jamaica | 0.1 /100 | #272 | Tragic 20.5% |
| Central Americans | 0.1 /100 | #273 | Tragic 20.6% |
| Immigrants | Belize | 0.1 /100 | #274 | Tragic 20.6% |
Demographics Similar to Apache by Child Poverty Under the Age of 5
In terms of child poverty under the age of 5, the demographic groups most similar to Apache are Kiowa (24.5%, a difference of 2.2%), Native/Alaskan (25.6%, a difference of 2.2%), Black/African American (25.7%, a difference of 2.8%), Colville (25.7%, a difference of 2.8%), and Creek (24.2%, a difference of 3.2%).
| Demographics | Rating | Rank | Child Poverty Under the Age of 5 |
| Immigrants | Congo | 0.0 /100 | #325 | Tragic 23.9% |
| Central American Indians | 0.0 /100 | #326 | Tragic 23.9% |
| Dominicans | 0.0 /100 | #327 | Tragic 24.0% |
| Immigrants | Dominican Republic | 0.0 /100 | #328 | Tragic 24.1% |
| Cajuns | 0.0 /100 | #329 | Tragic 24.1% |
| Creek | 0.0 /100 | #330 | Tragic 24.2% |
| Kiowa | 0.0 /100 | #331 | Tragic 24.5% |
| Apache | 0.0 /100 | #332 | Tragic 25.0% |
| Natives/Alaskans | 0.0 /100 | #333 | Tragic 25.6% |
| Blacks/African Americans | 0.0 /100 | #334 | Tragic 25.7% |
| Colville | 0.0 /100 | #335 | Tragic 25.7% |
| Sioux | 0.0 /100 | #336 | Tragic 26.9% |
| Pima | 0.0 /100 | #337 | Tragic 27.4% |
| Hopi | 0.0 /100 | #338 | Tragic 27.7% |
| Yup'ik | 0.0 /100 | #339 | Tragic 27.7% |