Ottawa vs Apache 4 or more Vehicles in Household
COMPARE
Ottawa
Apache
4 or more Vehicles in Household
4 or more Vehicles in Household Comparison
Ottawa
Apache
6.6%
4 OR MORE VEHICLES IN HOUSEHOLD
86.9/ 100
METRIC RATING
134th/ 347
METRIC RANK
7.4%
4 OR MORE VEHICLES IN HOUSEHOLD
99.9/ 100
METRIC RATING
77th/ 347
METRIC RANK
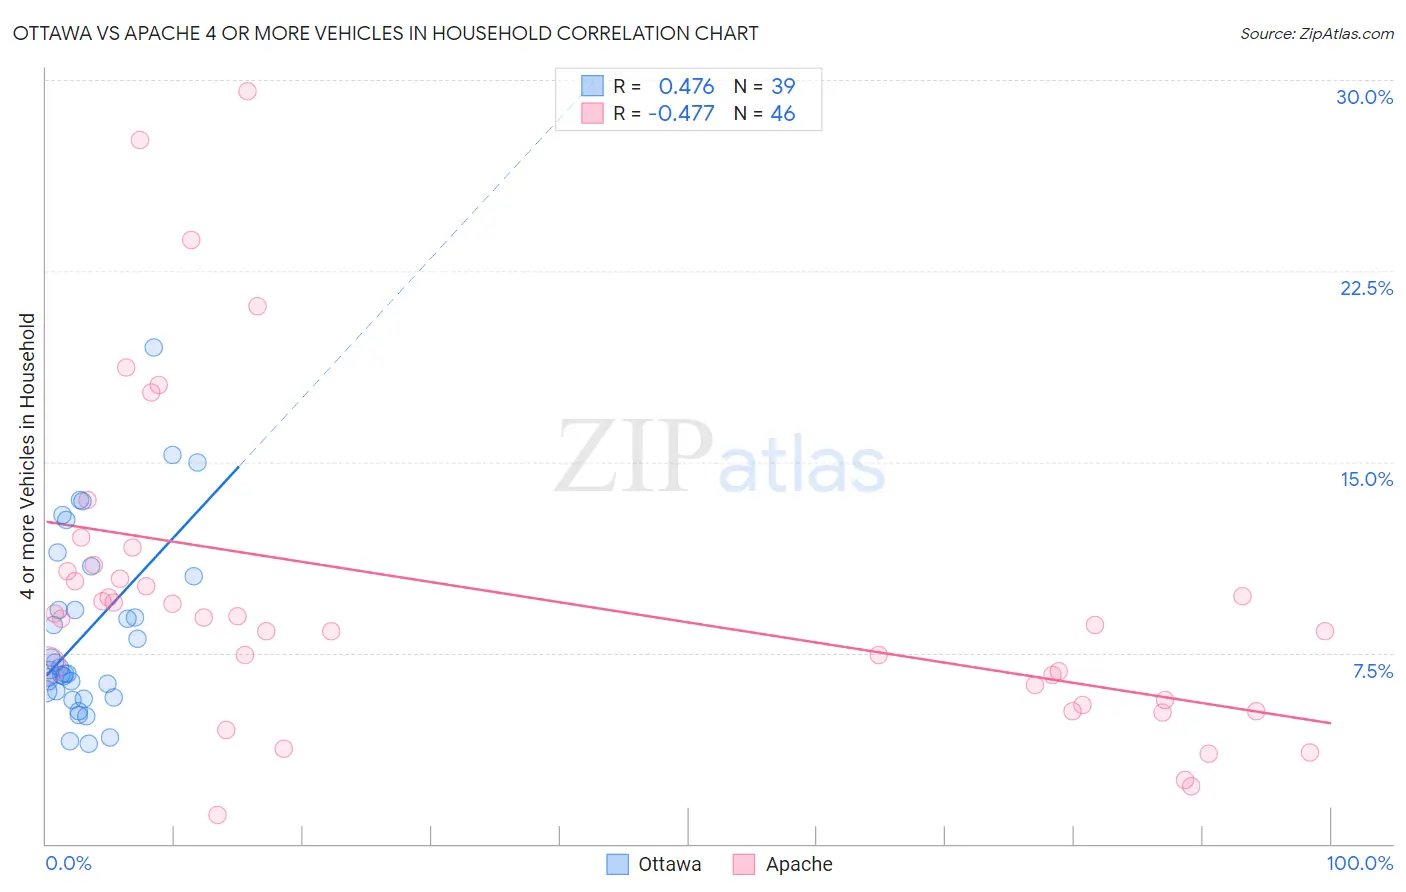
Ottawa vs Apache 4 or more Vehicles in Household Correlation Chart
The statistical analysis conducted on geographies consisting of 49,927,174 people shows a moderate positive correlation between the proportion of Ottawa and percentage of households with 4 or more vehicles available in the United States with a correlation coefficient (R) of 0.476 and weighted average of 6.6%. Similarly, the statistical analysis conducted on geographies consisting of 230,812,683 people shows a moderate negative correlation between the proportion of Apache and percentage of households with 4 or more vehicles available in the United States with a correlation coefficient (R) of -0.477 and weighted average of 7.4%, a difference of 11.2%.
4 or more Vehicles in Household Correlation Summary
| Measurement | Ottawa | Apache |
| Minimum | 4.0% | 1.1% |
| Maximum | 19.5% | 29.6% |
| Range | 15.6% | 28.5% |
| Mean | 8.3% | 9.8% |
| Median | 6.8% | 8.9% |
| Interquartile 25% (IQ1) | 6.0% | 5.6% |
| Interquartile 75% (IQ3) | 10.5% | 10.7% |
| Interquartile Range (IQR) | 4.5% | 5.1% |
| Standard Deviation (Sample) | 3.6% | 6.2% |
| Standard Deviation (Population) | 3.5% | 6.2% |
Similar Demographics by 4 or more Vehicles in Household
Demographics Similar to Ottawa by 4 or more Vehicles in Household
In terms of 4 or more vehicles in household, the demographic groups most similar to Ottawa are Armenian (6.6%, a difference of 0.020%), Tohono O'odham (6.6%, a difference of 0.030%), Luxembourger (6.6%, a difference of 0.10%), Immigrants from Netherlands (6.6%, a difference of 0.21%), and French Canadian (6.6%, a difference of 0.30%).
| Demographics | Rating | Rank | 4 or more Vehicles in Household |
| Immigrants | Korea | 93.8 /100 | #127 | Exceptional 6.8% |
| Immigrants | Bolivia | 92.5 /100 | #128 | Exceptional 6.7% |
| Immigrants | England | 92.0 /100 | #129 | Exceptional 6.7% |
| Immigrants | Scotland | 89.0 /100 | #130 | Excellent 6.7% |
| Maltese | 88.4 /100 | #131 | Excellent 6.7% |
| Immigrants | Netherlands | 87.8 /100 | #132 | Excellent 6.6% |
| Armenians | 86.9 /100 | #133 | Excellent 6.6% |
| Ottawa | 86.9 /100 | #134 | Excellent 6.6% |
| Tohono O'odham | 86.7 /100 | #135 | Excellent 6.6% |
| Luxembourgers | 86.4 /100 | #136 | Excellent 6.6% |
| French Canadians | 85.4 /100 | #137 | Excellent 6.6% |
| Italians | 84.5 /100 | #138 | Excellent 6.6% |
| Jordanians | 82.1 /100 | #139 | Excellent 6.6% |
| Slavs | 81.6 /100 | #140 | Excellent 6.6% |
| Australians | 80.8 /100 | #141 | Excellent 6.6% |
Demographics Similar to Apache by 4 or more Vehicles in Household
In terms of 4 or more vehicles in household, the demographic groups most similar to Apache are White/Caucasian (7.4%, a difference of 0.060%), Laotian (7.4%, a difference of 0.17%), Icelander (7.4%, a difference of 0.22%), Immigrants from Cambodia (7.4%, a difference of 0.22%), and Czech (7.4%, a difference of 0.24%).
| Demographics | Rating | Rank | 4 or more Vehicles in Household |
| Scottish | 99.9 /100 | #70 | Exceptional 7.4% |
| Chickasaw | 99.9 /100 | #71 | Exceptional 7.4% |
| Scotch-Irish | 99.9 /100 | #72 | Exceptional 7.4% |
| Portuguese | 99.9 /100 | #73 | Exceptional 7.4% |
| Icelanders | 99.9 /100 | #74 | Exceptional 7.4% |
| Immigrants | Cambodia | 99.9 /100 | #75 | Exceptional 7.4% |
| Laotians | 99.9 /100 | #76 | Exceptional 7.4% |
| Apache | 99.9 /100 | #77 | Exceptional 7.4% |
| Whites/Caucasians | 99.8 /100 | #78 | Exceptional 7.4% |
| Czechs | 99.8 /100 | #79 | Exceptional 7.4% |
| Alaska Natives | 99.8 /100 | #80 | Exceptional 7.3% |
| Finns | 99.8 /100 | #81 | Exceptional 7.3% |
| Northern Europeans | 99.8 /100 | #82 | Exceptional 7.3% |
| Potawatomi | 99.7 /100 | #83 | Exceptional 7.3% |
| Afghans | 99.7 /100 | #84 | Exceptional 7.3% |