Argentinean vs Apache Receiving Food Stamps
COMPARE
Argentinean
Apache
Receiving Food Stamps
Receiving Food Stamps Comparison
Argentineans
Apache
10.8%
RECEIVING FOOD STAMPS
90.2/ 100
METRIC RATING
135th/ 347
METRIC RANK
18.3%
RECEIVING FOOD STAMPS
0.0/ 100
METRIC RATING
327th/ 347
METRIC RANK
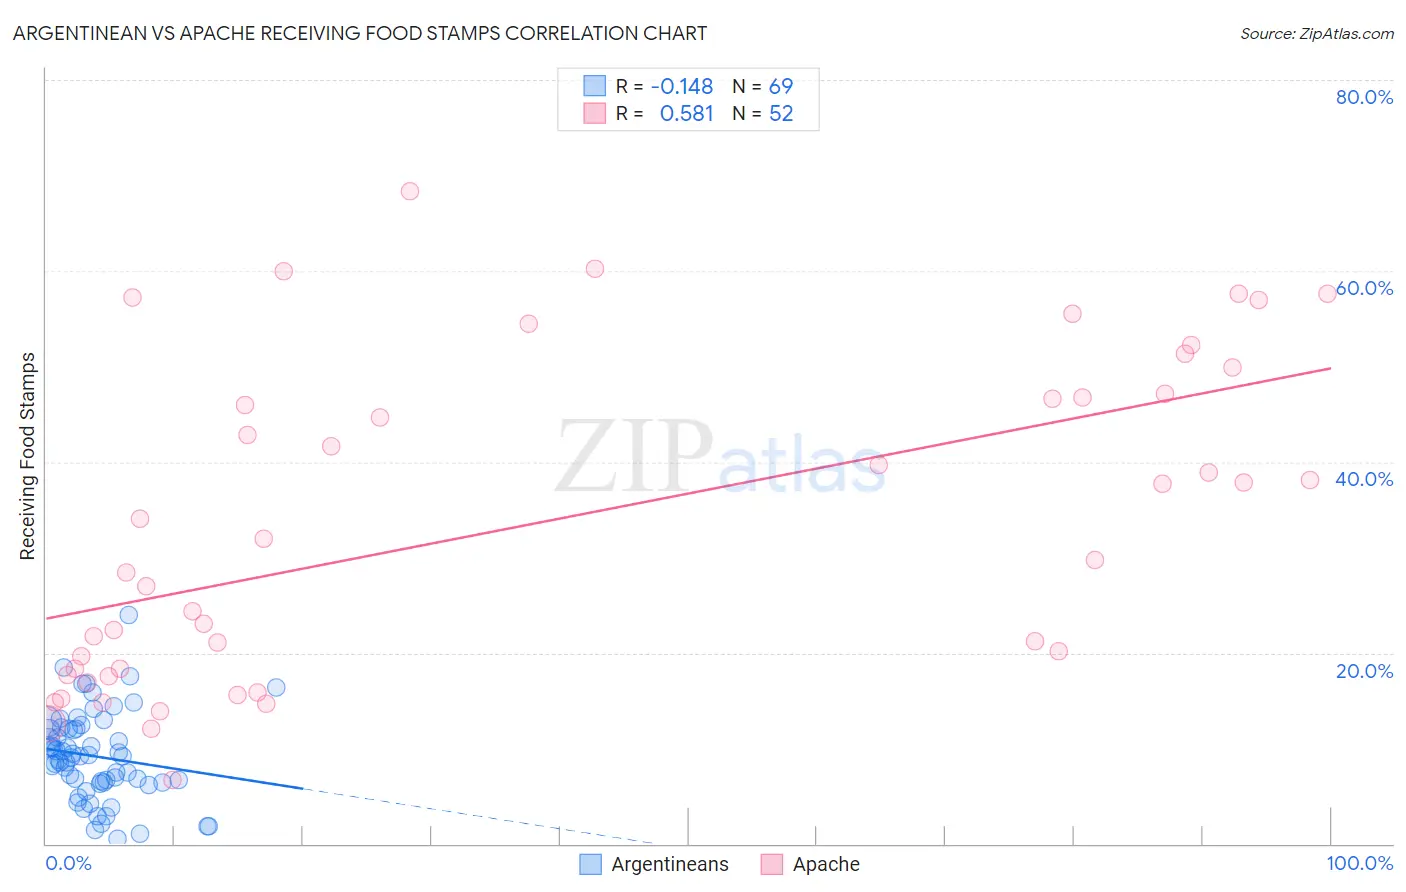
Argentinean vs Apache Receiving Food Stamps Correlation Chart
The statistical analysis conducted on geographies consisting of 296,410,032 people shows a poor negative correlation between the proportion of Argentineans and percentage of population receiving government assistance and/or food stamps in the United States with a correlation coefficient (R) of -0.148 and weighted average of 10.8%. Similarly, the statistical analysis conducted on geographies consisting of 230,963,565 people shows a substantial positive correlation between the proportion of Apache and percentage of population receiving government assistance and/or food stamps in the United States with a correlation coefficient (R) of 0.581 and weighted average of 18.3%, a difference of 68.9%.
Receiving Food Stamps Correlation Summary
| Measurement | Argentinean | Apache |
| Minimum | 0.50% | 6.6% |
| Maximum | 23.9% | 68.4% |
| Range | 23.4% | 61.8% |
| Mean | 9.1% | 33.4% |
| Median | 9.1% | 30.8% |
| Interquartile 25% (IQ1) | 6.4% | 18.0% |
| Interquartile 75% (IQ3) | 12.1% | 47.0% |
| Interquartile Range (IQR) | 5.7% | 29.0% |
| Standard Deviation (Sample) | 4.6% | 16.8% |
| Standard Deviation (Population) | 4.6% | 16.6% |
Similar Demographics by Receiving Food Stamps
Demographics Similar to Argentineans by Receiving Food Stamps
In terms of receiving food stamps, the demographic groups most similar to Argentineans are Immigrants from Brazil (10.8%, a difference of 0.020%), Slovak (10.8%, a difference of 0.17%), Immigrants from Eastern Europe (10.8%, a difference of 0.19%), Immigrants from Russia (10.8%, a difference of 0.32%), and Immigrants from Moldova (10.9%, a difference of 0.70%).
| Demographics | Rating | Rank | Receiving Food Stamps |
| Immigrants | Jordan | 92.5 /100 | #128 | Exceptional 10.7% |
| Yugoslavians | 92.5 /100 | #129 | Exceptional 10.7% |
| Israelis | 92.4 /100 | #130 | Exceptional 10.7% |
| French | 92.3 /100 | #131 | Exceptional 10.7% |
| Immigrants | Germany | 92.0 /100 | #132 | Exceptional 10.7% |
| Immigrants | Russia | 90.9 /100 | #133 | Exceptional 10.8% |
| Immigrants | Brazil | 90.3 /100 | #134 | Exceptional 10.8% |
| Argentineans | 90.2 /100 | #135 | Exceptional 10.8% |
| Slovaks | 89.8 /100 | #136 | Excellent 10.8% |
| Immigrants | Eastern Europe | 89.8 /100 | #137 | Excellent 10.8% |
| Immigrants | Moldova | 88.5 /100 | #138 | Excellent 10.9% |
| Hmong | 88.4 /100 | #139 | Excellent 10.9% |
| Celtics | 87.8 /100 | #140 | Excellent 10.9% |
| Immigrants | Vietnam | 86.7 /100 | #141 | Excellent 11.0% |
| Chileans | 86.2 /100 | #142 | Excellent 11.0% |
Demographics Similar to Apache by Receiving Food Stamps
In terms of receiving food stamps, the demographic groups most similar to Apache are Colville (18.3%, a difference of 0.21%), Cuban (18.2%, a difference of 0.31%), Immigrants from Haiti (18.2%, a difference of 0.42%), Immigrants from Dominica (18.4%, a difference of 0.67%), and British West Indian (17.9%, a difference of 2.2%).
| Demographics | Rating | Rank | Receiving Food Stamps |
| Immigrants | Nicaragua | 0.0 /100 | #320 | Tragic 17.2% |
| Natives/Alaskans | 0.0 /100 | #321 | Tragic 17.3% |
| Immigrants | Grenada | 0.0 /100 | #322 | Tragic 17.8% |
| Haitians | 0.0 /100 | #323 | Tragic 17.8% |
| British West Indians | 0.0 /100 | #324 | Tragic 17.9% |
| Immigrants | Haiti | 0.0 /100 | #325 | Tragic 18.2% |
| Cubans | 0.0 /100 | #326 | Tragic 18.2% |
| Apache | 0.0 /100 | #327 | Tragic 18.3% |
| Colville | 0.0 /100 | #328 | Tragic 18.3% |
| Immigrants | Dominica | 0.0 /100 | #329 | Tragic 18.4% |
| Pima | 0.0 /100 | #330 | Tragic 19.0% |
| Immigrants | Caribbean | 0.0 /100 | #331 | Tragic 19.6% |
| Pueblo | 0.0 /100 | #332 | Tragic 19.9% |
| Inupiat | 0.0 /100 | #333 | Tragic 20.1% |
| Yuman | 0.0 /100 | #334 | Tragic 20.2% |