Okinawan vs Apache Receiving Food Stamps
COMPARE
Okinawan
Apache
Receiving Food Stamps
Receiving Food Stamps Comparison
Okinawans
Apache
8.9%
RECEIVING FOOD STAMPS
99.9/ 100
METRIC RATING
11th/ 347
METRIC RANK
18.3%
RECEIVING FOOD STAMPS
0.0/ 100
METRIC RATING
327th/ 347
METRIC RANK
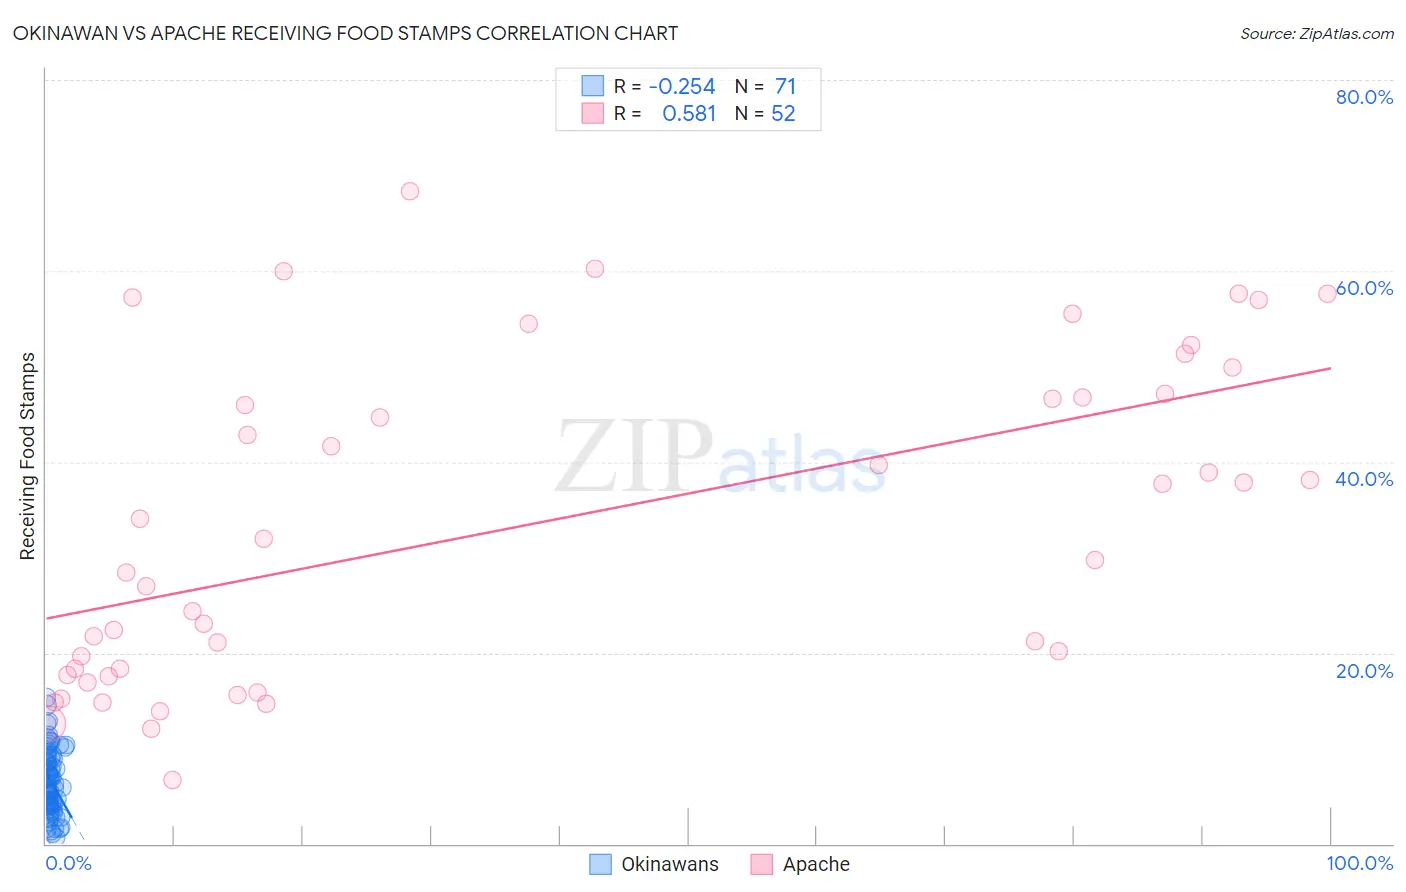
Okinawan vs Apache Receiving Food Stamps Correlation Chart
The statistical analysis conducted on geographies consisting of 73,571,871 people shows a weak negative correlation between the proportion of Okinawans and percentage of population receiving government assistance and/or food stamps in the United States with a correlation coefficient (R) of -0.254 and weighted average of 8.9%. Similarly, the statistical analysis conducted on geographies consisting of 230,963,565 people shows a substantial positive correlation between the proportion of Apache and percentage of population receiving government assistance and/or food stamps in the United States with a correlation coefficient (R) of 0.581 and weighted average of 18.3%, a difference of 106.1%.
Receiving Food Stamps Correlation Summary
| Measurement | Okinawan | Apache |
| Minimum | 0.70% | 6.6% |
| Maximum | 15.3% | 68.4% |
| Range | 14.6% | 61.8% |
| Mean | 6.5% | 33.4% |
| Median | 6.3% | 30.8% |
| Interquartile 25% (IQ1) | 4.0% | 18.0% |
| Interquartile 75% (IQ3) | 9.2% | 47.0% |
| Interquartile Range (IQR) | 5.2% | 29.0% |
| Standard Deviation (Sample) | 3.4% | 16.8% |
| Standard Deviation (Population) | 3.4% | 16.6% |
Similar Demographics by Receiving Food Stamps
Demographics Similar to Okinawans by Receiving Food Stamps
In terms of receiving food stamps, the demographic groups most similar to Okinawans are Cypriot (8.9%, a difference of 0.010%), Bulgarian (8.9%, a difference of 0.20%), Maltese (8.9%, a difference of 0.33%), Immigrants from South Central Asia (8.8%, a difference of 0.43%), and Norwegian (9.0%, a difference of 0.99%).
| Demographics | Rating | Rank | Receiving Food Stamps |
| Iranians | 100.0 /100 | #4 | Exceptional 7.9% |
| Thais | 100.0 /100 | #5 | Exceptional 8.1% |
| Immigrants | Singapore | 100.0 /100 | #6 | Exceptional 8.3% |
| Immigrants | Iran | 100.0 /100 | #7 | Exceptional 8.3% |
| Burmese | 99.9 /100 | #8 | Exceptional 8.6% |
| Immigrants | Korea | 99.9 /100 | #9 | Exceptional 8.7% |
| Immigrants | South Central Asia | 99.9 /100 | #10 | Exceptional 8.8% |
| Okinawans | 99.9 /100 | #11 | Exceptional 8.9% |
| Cypriots | 99.9 /100 | #12 | Exceptional 8.9% |
| Bulgarians | 99.9 /100 | #13 | Exceptional 8.9% |
| Maltese | 99.9 /100 | #14 | Exceptional 8.9% |
| Norwegians | 99.9 /100 | #15 | Exceptional 9.0% |
| Immigrants | Japan | 99.9 /100 | #16 | Exceptional 9.0% |
| Immigrants | Scotland | 99.9 /100 | #17 | Exceptional 9.0% |
| Danes | 99.9 /100 | #18 | Exceptional 9.0% |
Demographics Similar to Apache by Receiving Food Stamps
In terms of receiving food stamps, the demographic groups most similar to Apache are Colville (18.3%, a difference of 0.21%), Cuban (18.2%, a difference of 0.31%), Immigrants from Haiti (18.2%, a difference of 0.42%), Immigrants from Dominica (18.4%, a difference of 0.67%), and British West Indian (17.9%, a difference of 2.2%).
| Demographics | Rating | Rank | Receiving Food Stamps |
| Immigrants | Nicaragua | 0.0 /100 | #320 | Tragic 17.2% |
| Natives/Alaskans | 0.0 /100 | #321 | Tragic 17.3% |
| Immigrants | Grenada | 0.0 /100 | #322 | Tragic 17.8% |
| Haitians | 0.0 /100 | #323 | Tragic 17.8% |
| British West Indians | 0.0 /100 | #324 | Tragic 17.9% |
| Immigrants | Haiti | 0.0 /100 | #325 | Tragic 18.2% |
| Cubans | 0.0 /100 | #326 | Tragic 18.2% |
| Apache | 0.0 /100 | #327 | Tragic 18.3% |
| Colville | 0.0 /100 | #328 | Tragic 18.3% |
| Immigrants | Dominica | 0.0 /100 | #329 | Tragic 18.4% |
| Pima | 0.0 /100 | #330 | Tragic 19.0% |
| Immigrants | Caribbean | 0.0 /100 | #331 | Tragic 19.6% |
| Pueblo | 0.0 /100 | #332 | Tragic 19.9% |
| Inupiat | 0.0 /100 | #333 | Tragic 20.1% |
| Yuman | 0.0 /100 | #334 | Tragic 20.2% |