Osage vs Yaqui Single Male Poverty
COMPARE
Osage
Yaqui
Single Male Poverty
Single Male Poverty Comparison
Osage
Yaqui
16.5%
SINGLE MALE POVERTY
0.0/ 100
METRIC RATING
321st/ 347
METRIC RANK
14.2%
SINGLE MALE POVERTY
0.0/ 100
METRIC RATING
283rd/ 347
METRIC RANK
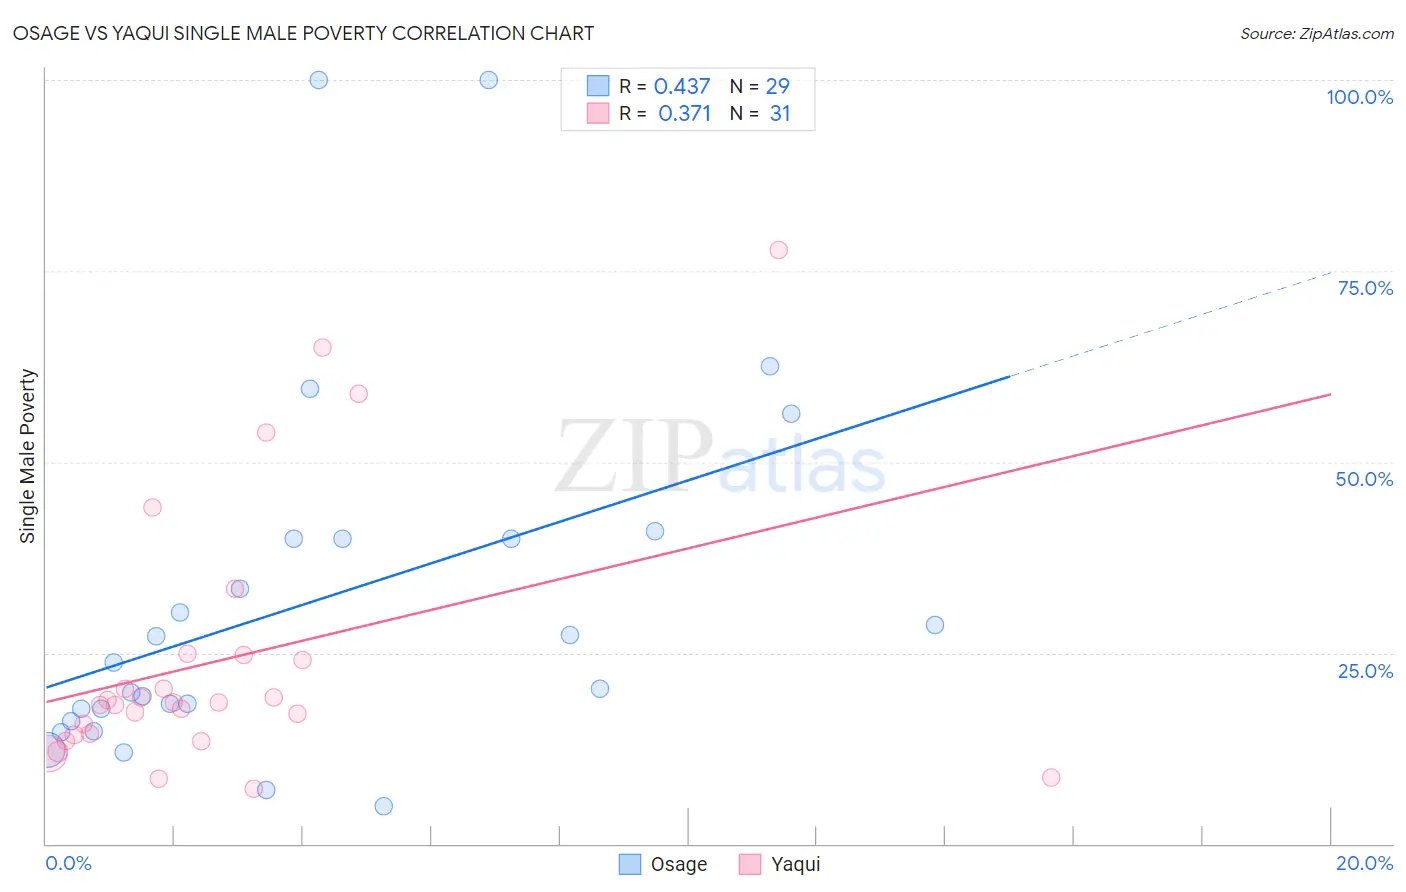
Osage vs Yaqui Single Male Poverty Correlation Chart
The statistical analysis conducted on geographies consisting of 87,587,587 people shows a moderate positive correlation between the proportion of Osage and poverty level among single males in the United States with a correlation coefficient (R) of 0.437 and weighted average of 16.5%. Similarly, the statistical analysis conducted on geographies consisting of 103,533,102 people shows a mild positive correlation between the proportion of Yaqui and poverty level among single males in the United States with a correlation coefficient (R) of 0.371 and weighted average of 14.2%, a difference of 15.6%.
Single Male Poverty Correlation Summary
| Measurement | Osage | Yaqui |
| Minimum | 5.0% | 7.2% |
| Maximum | 100.0% | 77.8% |
| Range | 95.0% | 70.6% |
| Mean | 31.8% | 24.1% |
| Median | 23.8% | 18.4% |
| Interquartile 25% (IQ1) | 16.9% | 14.2% |
| Interquartile 75% (IQ3) | 40.0% | 24.8% |
| Interquartile Range (IQR) | 23.1% | 10.5% |
| Standard Deviation (Sample) | 24.0% | 17.4% |
| Standard Deviation (Population) | 23.6% | 17.1% |
Similar Demographics by Single Male Poverty
Demographics Similar to Osage by Single Male Poverty
In terms of single male poverty, the demographic groups most similar to Osage are Marshallese (16.4%, a difference of 0.13%), Chippewa (16.4%, a difference of 0.61%), Chickasaw (16.3%, a difference of 0.91%), Shoshone (16.7%, a difference of 1.3%), and Black/African American (16.2%, a difference of 1.7%).
| Demographics | Rating | Rank | Single Male Poverty |
| Alaskan Athabascans | 0.0 /100 | #314 | Tragic 16.1% |
| Cheyenne | 0.0 /100 | #315 | Tragic 16.1% |
| Dutch West Indians | 0.0 /100 | #316 | Tragic 16.1% |
| Blacks/African Americans | 0.0 /100 | #317 | Tragic 16.2% |
| Chickasaw | 0.0 /100 | #318 | Tragic 16.3% |
| Chippewa | 0.0 /100 | #319 | Tragic 16.4% |
| Marshallese | 0.0 /100 | #320 | Tragic 16.4% |
| Osage | 0.0 /100 | #321 | Tragic 16.5% |
| Shoshone | 0.0 /100 | #322 | Tragic 16.7% |
| Creek | 0.0 /100 | #323 | Tragic 16.8% |
| Immigrants | Yemen | 0.0 /100 | #324 | Tragic 16.9% |
| Choctaw | 0.0 /100 | #325 | Tragic 17.0% |
| Central American Indians | 0.0 /100 | #326 | Tragic 17.2% |
| Menominee | 0.0 /100 | #327 | Tragic 17.7% |
| Kiowa | 0.0 /100 | #328 | Tragic 18.3% |
Demographics Similar to Yaqui by Single Male Poverty
In terms of single male poverty, the demographic groups most similar to Yaqui are Spanish American (14.2%, a difference of 0.16%), Hispanic or Latino (14.2%, a difference of 0.32%), Hmong (14.2%, a difference of 0.34%), Indonesian (14.1%, a difference of 1.1%), and Slovak (14.1%, a difference of 1.1%).
| Demographics | Rating | Rank | Single Male Poverty |
| Dutch | 0.1 /100 | #276 | Tragic 14.1% |
| Immigrants | Honduras | 0.0 /100 | #277 | Tragic 14.1% |
| Slovaks | 0.0 /100 | #278 | Tragic 14.1% |
| Indonesians | 0.0 /100 | #279 | Tragic 14.1% |
| Hmong | 0.0 /100 | #280 | Tragic 14.2% |
| Hispanics or Latinos | 0.0 /100 | #281 | Tragic 14.2% |
| Spanish Americans | 0.0 /100 | #282 | Tragic 14.2% |
| Yaqui | 0.0 /100 | #283 | Tragic 14.2% |
| Immigrants | Bahamas | 0.0 /100 | #284 | Tragic 14.4% |
| French | 0.0 /100 | #285 | Tragic 14.4% |
| Celtics | 0.0 /100 | #286 | Tragic 14.5% |
| Iroquois | 0.0 /100 | #287 | Tragic 14.5% |
| Whites/Caucasians | 0.0 /100 | #288 | Tragic 14.5% |
| Immigrants | Dominica | 0.0 /100 | #289 | Tragic 14.5% |
| U.S. Virgin Islanders | 0.0 /100 | #290 | Tragic 14.5% |