Osage vs Basque Single Male Poverty
COMPARE
Osage
Basque
Single Male Poverty
Single Male Poverty Comparison
Osage
Basques
16.5%
SINGLE MALE POVERTY
0.0/ 100
METRIC RATING
321st/ 347
METRIC RANK
13.0%
SINGLE MALE POVERTY
20.7/ 100
METRIC RATING
202nd/ 347
METRIC RANK
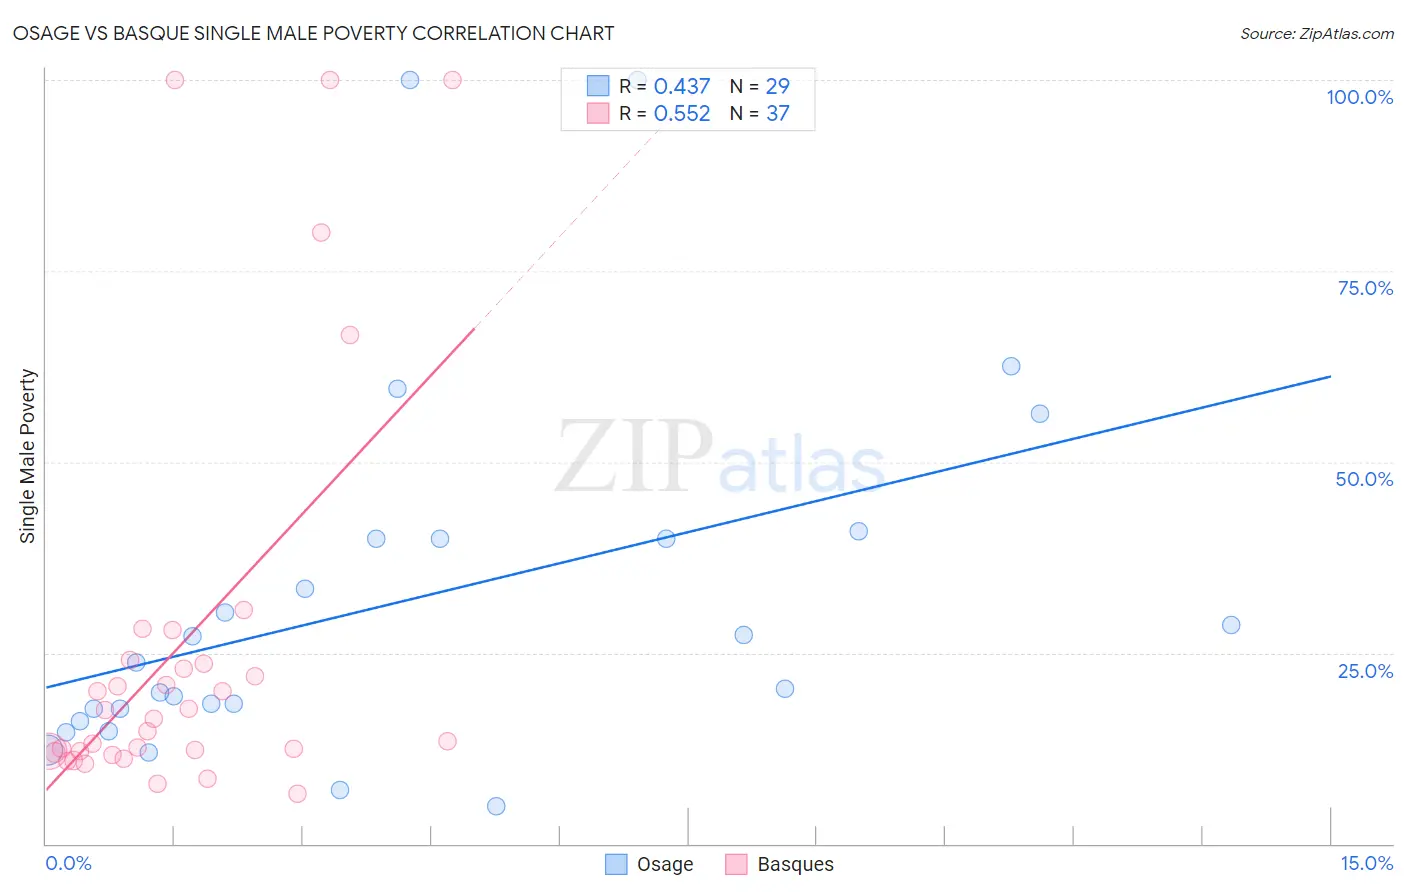
Osage vs Basque Single Male Poverty Correlation Chart
The statistical analysis conducted on geographies consisting of 87,587,587 people shows a moderate positive correlation between the proportion of Osage and poverty level among single males in the United States with a correlation coefficient (R) of 0.437 and weighted average of 16.5%. Similarly, the statistical analysis conducted on geographies consisting of 155,521,610 people shows a substantial positive correlation between the proportion of Basques and poverty level among single males in the United States with a correlation coefficient (R) of 0.552 and weighted average of 13.0%, a difference of 26.4%.
Single Male Poverty Correlation Summary
| Measurement | Osage | Basque |
| Minimum | 5.0% | 6.6% |
| Maximum | 100.0% | 100.0% |
| Range | 95.0% | 93.4% |
| Mean | 31.8% | 26.0% |
| Median | 23.8% | 16.3% |
| Interquartile 25% (IQ1) | 16.9% | 12.0% |
| Interquartile 75% (IQ3) | 40.0% | 23.8% |
| Interquartile Range (IQR) | 23.1% | 11.8% |
| Standard Deviation (Sample) | 24.0% | 26.5% |
| Standard Deviation (Population) | 23.6% | 26.2% |
Similar Demographics by Single Male Poverty
Demographics Similar to Osage by Single Male Poverty
In terms of single male poverty, the demographic groups most similar to Osage are Marshallese (16.4%, a difference of 0.13%), Chippewa (16.4%, a difference of 0.61%), Chickasaw (16.3%, a difference of 0.91%), Shoshone (16.7%, a difference of 1.3%), and Black/African American (16.2%, a difference of 1.7%).
| Demographics | Rating | Rank | Single Male Poverty |
| Alaskan Athabascans | 0.0 /100 | #314 | Tragic 16.1% |
| Cheyenne | 0.0 /100 | #315 | Tragic 16.1% |
| Dutch West Indians | 0.0 /100 | #316 | Tragic 16.1% |
| Blacks/African Americans | 0.0 /100 | #317 | Tragic 16.2% |
| Chickasaw | 0.0 /100 | #318 | Tragic 16.3% |
| Chippewa | 0.0 /100 | #319 | Tragic 16.4% |
| Marshallese | 0.0 /100 | #320 | Tragic 16.4% |
| Osage | 0.0 /100 | #321 | Tragic 16.5% |
| Shoshone | 0.0 /100 | #322 | Tragic 16.7% |
| Creek | 0.0 /100 | #323 | Tragic 16.8% |
| Immigrants | Yemen | 0.0 /100 | #324 | Tragic 16.9% |
| Choctaw | 0.0 /100 | #325 | Tragic 17.0% |
| Central American Indians | 0.0 /100 | #326 | Tragic 17.2% |
| Menominee | 0.0 /100 | #327 | Tragic 17.7% |
| Kiowa | 0.0 /100 | #328 | Tragic 18.3% |
Demographics Similar to Basques by Single Male Poverty
In terms of single male poverty, the demographic groups most similar to Basques are Immigrants from Bangladesh (13.0%, a difference of 0.030%), Estonian (13.0%, a difference of 0.030%), Trinidadian and Tobagonian (13.0%, a difference of 0.060%), Slovene (13.0%, a difference of 0.070%), and Immigrants from Norway (13.0%, a difference of 0.090%).
| Demographics | Rating | Rank | Single Male Poverty |
| Immigrants | England | 23.4 /100 | #195 | Fair 13.0% |
| Immigrants | Grenada | 23.1 /100 | #196 | Fair 13.0% |
| Immigrants | Laos | 23.1 /100 | #197 | Fair 13.0% |
| Lithuanians | 22.1 /100 | #198 | Fair 13.0% |
| Immigrants | Norway | 21.8 /100 | #199 | Fair 13.0% |
| Slovenes | 21.6 /100 | #200 | Fair 13.0% |
| Trinidadians and Tobagonians | 21.4 /100 | #201 | Fair 13.0% |
| Basques | 20.7 /100 | #202 | Fair 13.0% |
| Immigrants | Bangladesh | 20.4 /100 | #203 | Fair 13.0% |
| Estonians | 20.3 /100 | #204 | Fair 13.0% |
| Poles | 19.3 /100 | #205 | Poor 13.0% |
| Northern Europeans | 18.9 /100 | #206 | Poor 13.0% |
| Sudanese | 17.7 /100 | #207 | Poor 13.1% |
| Immigrants | Western Africa | 17.6 /100 | #208 | Poor 13.1% |
| Mexican American Indians | 17.5 /100 | #209 | Poor 13.1% |