Osage vs Immigrants from Caribbean Single Male Poverty
COMPARE
Osage
Immigrants from Caribbean
Single Male Poverty
Single Male Poverty Comparison
Osage
Immigrants from Caribbean
16.5%
SINGLE MALE POVERTY
0.0/ 100
METRIC RATING
321st/ 347
METRIC RANK
13.3%
SINGLE MALE POVERTY
5.0/ 100
METRIC RATING
232nd/ 347
METRIC RANK
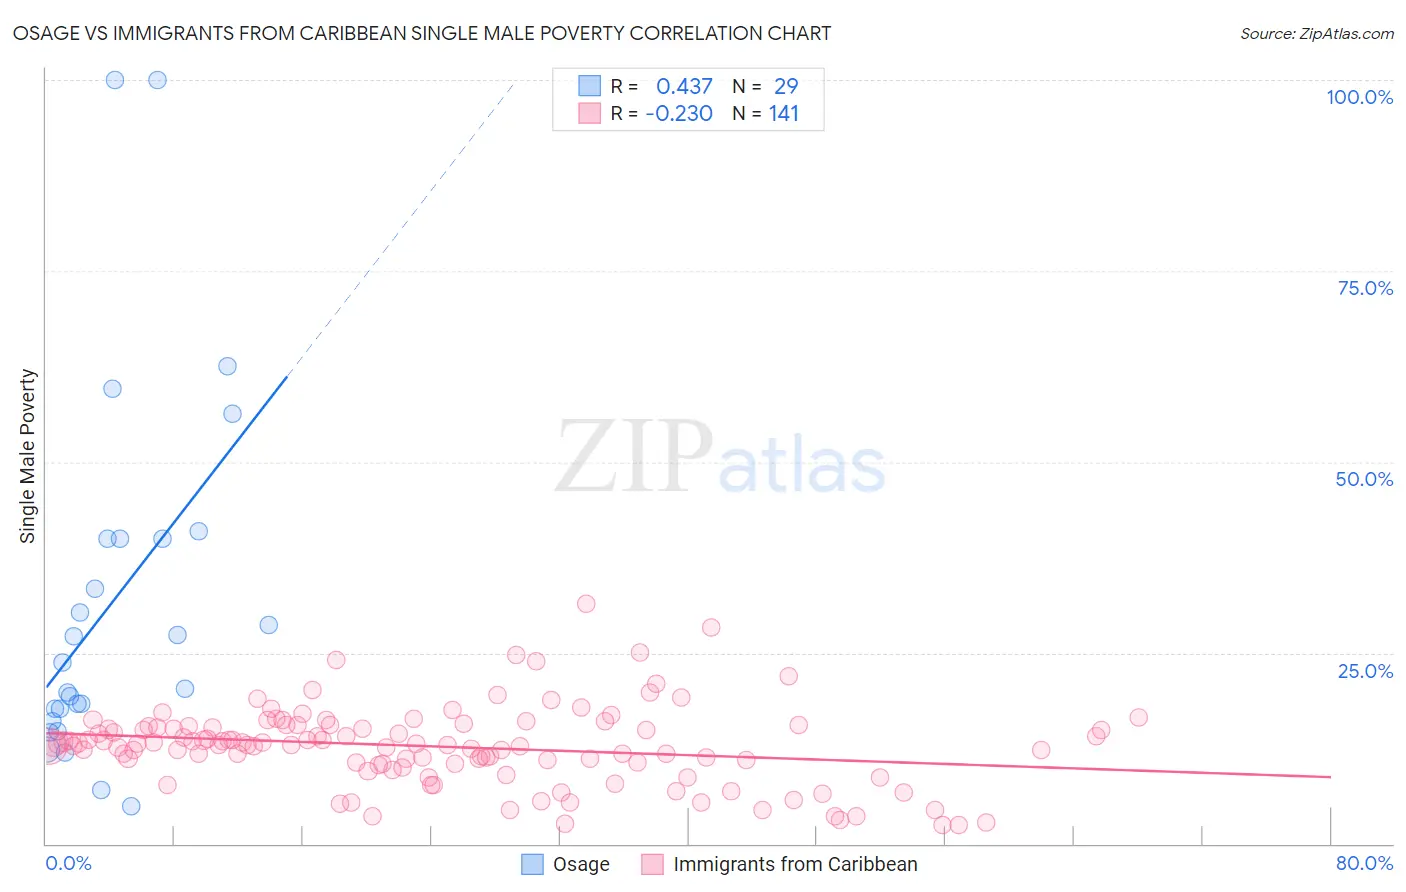
Osage vs Immigrants from Caribbean Single Male Poverty Correlation Chart
The statistical analysis conducted on geographies consisting of 87,587,587 people shows a moderate positive correlation between the proportion of Osage and poverty level among single males in the United States with a correlation coefficient (R) of 0.437 and weighted average of 16.5%. Similarly, the statistical analysis conducted on geographies consisting of 393,892,998 people shows a weak negative correlation between the proportion of Immigrants from Caribbean and poverty level among single males in the United States with a correlation coefficient (R) of -0.230 and weighted average of 13.3%, a difference of 23.8%.
Single Male Poverty Correlation Summary
| Measurement | Osage | Immigrants from Caribbean |
| Minimum | 5.0% | 2.4% |
| Maximum | 100.0% | 31.5% |
| Range | 95.0% | 29.0% |
| Mean | 31.8% | 12.8% |
| Median | 23.8% | 13.0% |
| Interquartile 25% (IQ1) | 16.9% | 10.5% |
| Interquartile 75% (IQ3) | 40.0% | 15.4% |
| Interquartile Range (IQR) | 23.1% | 4.9% |
| Standard Deviation (Sample) | 24.0% | 5.1% |
| Standard Deviation (Population) | 23.6% | 5.1% |
Similar Demographics by Single Male Poverty
Demographics Similar to Osage by Single Male Poverty
In terms of single male poverty, the demographic groups most similar to Osage are Marshallese (16.4%, a difference of 0.13%), Chippewa (16.4%, a difference of 0.61%), Chickasaw (16.3%, a difference of 0.91%), Shoshone (16.7%, a difference of 1.3%), and Black/African American (16.2%, a difference of 1.7%).
| Demographics | Rating | Rank | Single Male Poverty |
| Alaskan Athabascans | 0.0 /100 | #314 | Tragic 16.1% |
| Cheyenne | 0.0 /100 | #315 | Tragic 16.1% |
| Dutch West Indians | 0.0 /100 | #316 | Tragic 16.1% |
| Blacks/African Americans | 0.0 /100 | #317 | Tragic 16.2% |
| Chickasaw | 0.0 /100 | #318 | Tragic 16.3% |
| Chippewa | 0.0 /100 | #319 | Tragic 16.4% |
| Marshallese | 0.0 /100 | #320 | Tragic 16.4% |
| Osage | 0.0 /100 | #321 | Tragic 16.5% |
| Shoshone | 0.0 /100 | #322 | Tragic 16.7% |
| Creek | 0.0 /100 | #323 | Tragic 16.8% |
| Immigrants | Yemen | 0.0 /100 | #324 | Tragic 16.9% |
| Choctaw | 0.0 /100 | #325 | Tragic 17.0% |
| Central American Indians | 0.0 /100 | #326 | Tragic 17.2% |
| Menominee | 0.0 /100 | #327 | Tragic 17.7% |
| Kiowa | 0.0 /100 | #328 | Tragic 18.3% |
Demographics Similar to Immigrants from Caribbean by Single Male Poverty
In terms of single male poverty, the demographic groups most similar to Immigrants from Caribbean are Slavic (13.3%, a difference of 0.090%), Ghanaian (13.3%, a difference of 0.27%), British (13.3%, a difference of 0.29%), Canadian (13.3%, a difference of 0.29%), and European (13.3%, a difference of 0.30%).
| Demographics | Rating | Rank | Single Male Poverty |
| Immigrants | Denmark | 8.7 /100 | #225 | Tragic 13.2% |
| Jamaicans | 7.7 /100 | #226 | Tragic 13.2% |
| Haitians | 7.0 /100 | #227 | Tragic 13.2% |
| Lebanese | 6.6 /100 | #228 | Tragic 13.2% |
| Europeans | 6.2 /100 | #229 | Tragic 13.3% |
| Ghanaians | 6.1 /100 | #230 | Tragic 13.3% |
| Slavs | 5.3 /100 | #231 | Tragic 13.3% |
| Immigrants | Caribbean | 5.0 /100 | #232 | Tragic 13.3% |
| British | 4.0 /100 | #233 | Tragic 13.3% |
| Canadians | 4.0 /100 | #234 | Tragic 13.3% |
| Bangladeshis | 3.7 /100 | #235 | Tragic 13.3% |
| Luxembourgers | 3.6 /100 | #236 | Tragic 13.4% |
| British West Indians | 3.4 /100 | #237 | Tragic 13.4% |
| Immigrants | Ghana | 3.2 /100 | #238 | Tragic 13.4% |
| Czechoslovakians | 3.0 /100 | #239 | Tragic 13.4% |