Osage vs Thai Single Male Poverty
COMPARE
Osage
Thai
Single Male Poverty
Single Male Poverty Comparison
Osage
Thais
16.5%
SINGLE MALE POVERTY
0.0/ 100
METRIC RATING
321st/ 347
METRIC RANK
10.8%
SINGLE MALE POVERTY
100.0/ 100
METRIC RATING
8th/ 347
METRIC RANK
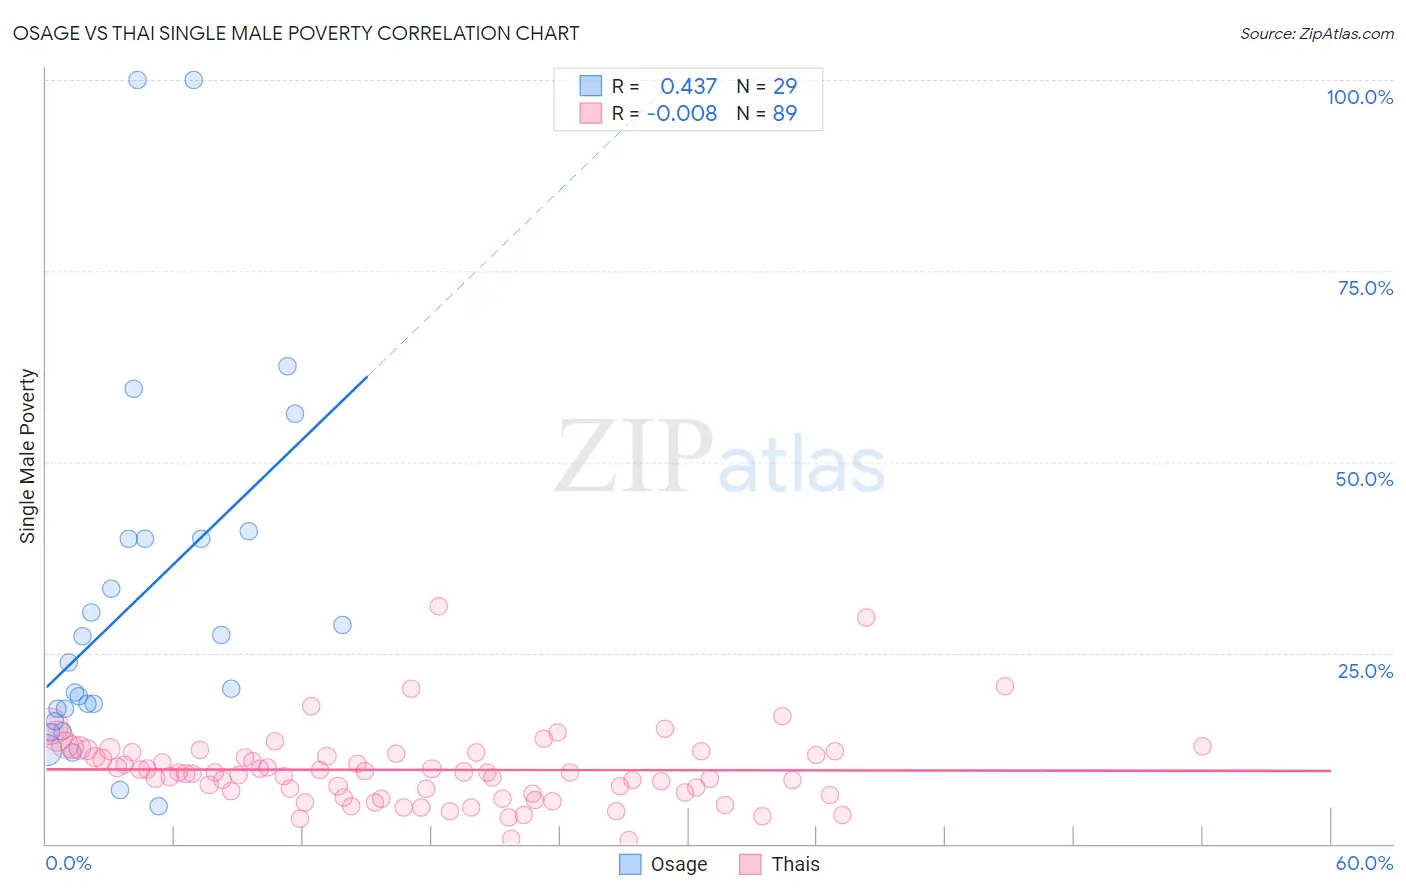
Osage vs Thai Single Male Poverty Correlation Chart
The statistical analysis conducted on geographies consisting of 87,587,587 people shows a moderate positive correlation between the proportion of Osage and poverty level among single males in the United States with a correlation coefficient (R) of 0.437 and weighted average of 16.5%. Similarly, the statistical analysis conducted on geographies consisting of 412,300,186 people shows no correlation between the proportion of Thais and poverty level among single males in the United States with a correlation coefficient (R) of -0.008 and weighted average of 10.8%, a difference of 53.1%.
Single Male Poverty Correlation Summary
| Measurement | Osage | Thai |
| Minimum | 5.0% | 0.44% |
| Maximum | 100.0% | 31.0% |
| Range | 95.0% | 30.6% |
| Mean | 31.8% | 9.7% |
| Median | 23.8% | 9.3% |
| Interquartile 25% (IQ1) | 16.9% | 6.4% |
| Interquartile 75% (IQ3) | 40.0% | 12.0% |
| Interquartile Range (IQR) | 23.1% | 5.6% |
| Standard Deviation (Sample) | 24.0% | 5.0% |
| Standard Deviation (Population) | 23.6% | 4.9% |
Similar Demographics by Single Male Poverty
Demographics Similar to Osage by Single Male Poverty
In terms of single male poverty, the demographic groups most similar to Osage are Marshallese (16.4%, a difference of 0.13%), Chippewa (16.4%, a difference of 0.61%), Chickasaw (16.3%, a difference of 0.91%), Shoshone (16.7%, a difference of 1.3%), and Black/African American (16.2%, a difference of 1.7%).
| Demographics | Rating | Rank | Single Male Poverty |
| Alaskan Athabascans | 0.0 /100 | #314 | Tragic 16.1% |
| Cheyenne | 0.0 /100 | #315 | Tragic 16.1% |
| Dutch West Indians | 0.0 /100 | #316 | Tragic 16.1% |
| Blacks/African Americans | 0.0 /100 | #317 | Tragic 16.2% |
| Chickasaw | 0.0 /100 | #318 | Tragic 16.3% |
| Chippewa | 0.0 /100 | #319 | Tragic 16.4% |
| Marshallese | 0.0 /100 | #320 | Tragic 16.4% |
| Osage | 0.0 /100 | #321 | Tragic 16.5% |
| Shoshone | 0.0 /100 | #322 | Tragic 16.7% |
| Creek | 0.0 /100 | #323 | Tragic 16.8% |
| Immigrants | Yemen | 0.0 /100 | #324 | Tragic 16.9% |
| Choctaw | 0.0 /100 | #325 | Tragic 17.0% |
| Central American Indians | 0.0 /100 | #326 | Tragic 17.2% |
| Menominee | 0.0 /100 | #327 | Tragic 17.7% |
| Kiowa | 0.0 /100 | #328 | Tragic 18.3% |
Demographics Similar to Thais by Single Male Poverty
In terms of single male poverty, the demographic groups most similar to Thais are Afghan (10.7%, a difference of 0.47%), Filipino (10.6%, a difference of 1.2%), Taiwanese (10.9%, a difference of 1.3%), Immigrants from Fiji (10.9%, a difference of 1.3%), and Immigrants from Philippines (10.9%, a difference of 1.3%).
| Demographics | Rating | Rank | Single Male Poverty |
| Assyrians/Chaldeans/Syriacs | 100.0 /100 | #1 | Exceptional 9.8% |
| Immigrants | Taiwan | 100.0 /100 | #2 | Exceptional 10.3% |
| Immigrants | India | 100.0 /100 | #3 | Exceptional 10.3% |
| Immigrants | Hong Kong | 100.0 /100 | #4 | Exceptional 10.4% |
| Tongans | 100.0 /100 | #5 | Exceptional 10.5% |
| Filipinos | 100.0 /100 | #6 | Exceptional 10.6% |
| Afghans | 100.0 /100 | #7 | Exceptional 10.7% |
| Thais | 100.0 /100 | #8 | Exceptional 10.8% |
| Taiwanese | 100.0 /100 | #9 | Exceptional 10.9% |
| Immigrants | Fiji | 100.0 /100 | #10 | Exceptional 10.9% |
| Immigrants | Philippines | 100.0 /100 | #11 | Exceptional 10.9% |
| Immigrants | Afghanistan | 100.0 /100 | #12 | Exceptional 10.9% |
| Immigrants | South Central Asia | 100.0 /100 | #13 | Exceptional 10.9% |
| Chinese | 100.0 /100 | #14 | Exceptional 11.0% |
| Koreans | 100.0 /100 | #15 | Exceptional 11.0% |