European vs Yaqui Single Male Poverty
COMPARE
European
Yaqui
Single Male Poverty
Single Male Poverty Comparison
Europeans
Yaqui
13.3%
SINGLE MALE POVERTY
6.2/ 100
METRIC RATING
229th/ 347
METRIC RANK
14.2%
SINGLE MALE POVERTY
0.0/ 100
METRIC RATING
283rd/ 347
METRIC RANK
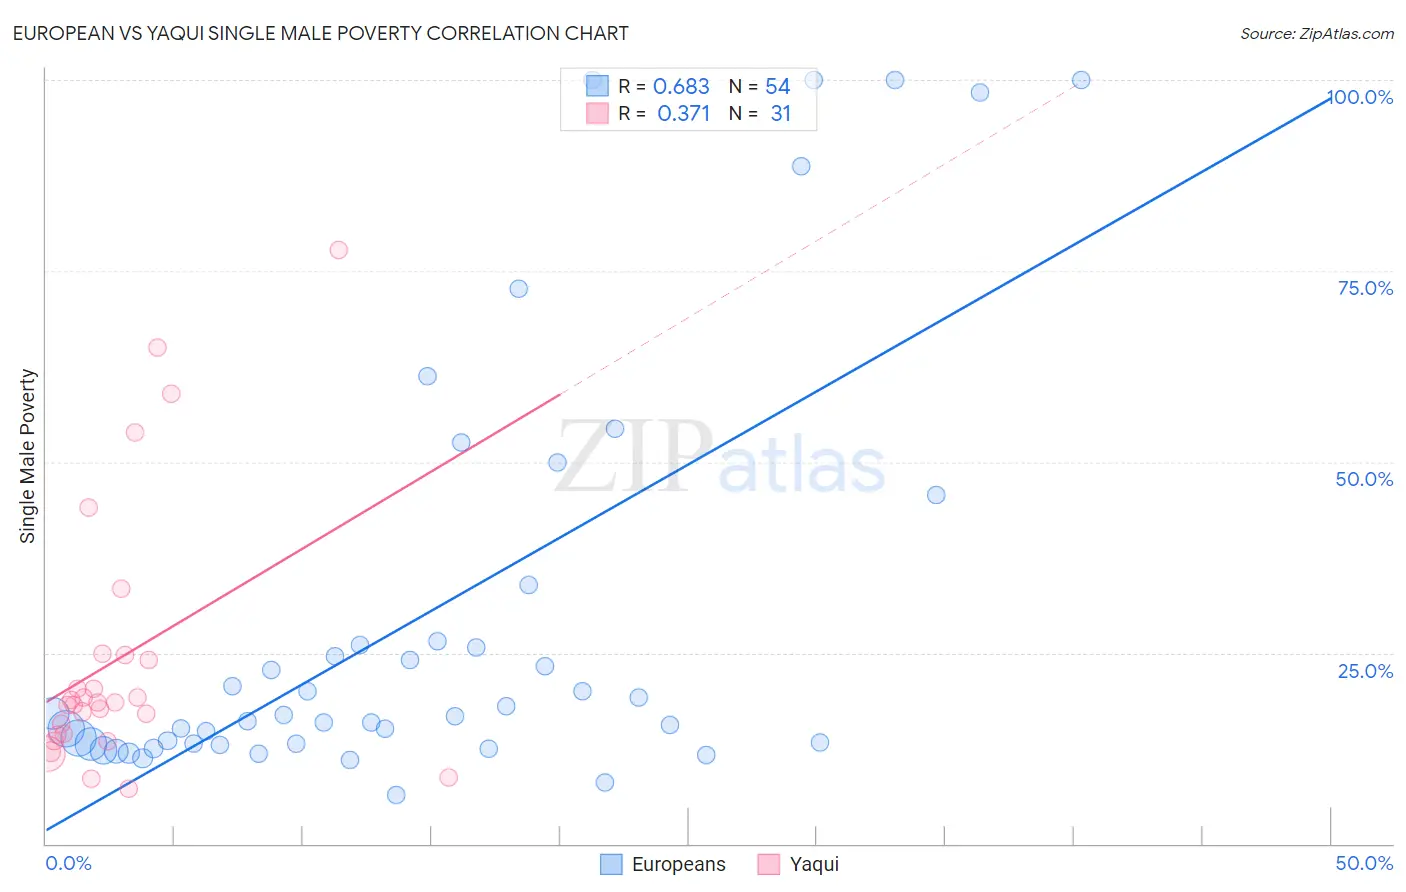
European vs Yaqui Single Male Poverty Correlation Chart
The statistical analysis conducted on geographies consisting of 466,343,596 people shows a significant positive correlation between the proportion of Europeans and poverty level among single males in the United States with a correlation coefficient (R) of 0.683 and weighted average of 13.3%. Similarly, the statistical analysis conducted on geographies consisting of 103,533,102 people shows a mild positive correlation between the proportion of Yaqui and poverty level among single males in the United States with a correlation coefficient (R) of 0.371 and weighted average of 14.2%, a difference of 7.5%.
Single Male Poverty Correlation Summary
| Measurement | European | Yaqui |
| Minimum | 6.4% | 7.2% |
| Maximum | 100.0% | 77.8% |
| Range | 93.6% | 70.6% |
| Mean | 29.9% | 24.1% |
| Median | 16.8% | 18.4% |
| Interquartile 25% (IQ1) | 13.1% | 14.2% |
| Interquartile 75% (IQ3) | 26.5% | 24.8% |
| Interquartile Range (IQR) | 13.3% | 10.5% |
| Standard Deviation (Sample) | 27.9% | 17.4% |
| Standard Deviation (Population) | 27.6% | 17.1% |
Similar Demographics by Single Male Poverty
Demographics Similar to Europeans by Single Male Poverty
In terms of single male poverty, the demographic groups most similar to Europeans are Ghanaian (13.3%, a difference of 0.030%), Lebanese (13.2%, a difference of 0.090%), Haitian (13.2%, a difference of 0.17%), Slavic (13.3%, a difference of 0.20%), and Immigrants from Caribbean (13.3%, a difference of 0.30%).
| Demographics | Rating | Rank | Single Male Poverty |
| Immigrants | Western Europe | 10.0 /100 | #222 | Poor 13.2% |
| Immigrants | Azores | 9.3 /100 | #223 | Tragic 13.2% |
| Somalis | 9.1 /100 | #224 | Tragic 13.2% |
| Immigrants | Denmark | 8.7 /100 | #225 | Tragic 13.2% |
| Jamaicans | 7.7 /100 | #226 | Tragic 13.2% |
| Haitians | 7.0 /100 | #227 | Tragic 13.2% |
| Lebanese | 6.6 /100 | #228 | Tragic 13.2% |
| Europeans | 6.2 /100 | #229 | Tragic 13.3% |
| Ghanaians | 6.1 /100 | #230 | Tragic 13.3% |
| Slavs | 5.3 /100 | #231 | Tragic 13.3% |
| Immigrants | Caribbean | 5.0 /100 | #232 | Tragic 13.3% |
| British | 4.0 /100 | #233 | Tragic 13.3% |
| Canadians | 4.0 /100 | #234 | Tragic 13.3% |
| Bangladeshis | 3.7 /100 | #235 | Tragic 13.3% |
| Luxembourgers | 3.6 /100 | #236 | Tragic 13.4% |
Demographics Similar to Yaqui by Single Male Poverty
In terms of single male poverty, the demographic groups most similar to Yaqui are Spanish American (14.2%, a difference of 0.16%), Hispanic or Latino (14.2%, a difference of 0.32%), Hmong (14.2%, a difference of 0.34%), Indonesian (14.1%, a difference of 1.1%), and Slovak (14.1%, a difference of 1.1%).
| Demographics | Rating | Rank | Single Male Poverty |
| Dutch | 0.1 /100 | #276 | Tragic 14.1% |
| Immigrants | Honduras | 0.0 /100 | #277 | Tragic 14.1% |
| Slovaks | 0.0 /100 | #278 | Tragic 14.1% |
| Indonesians | 0.0 /100 | #279 | Tragic 14.1% |
| Hmong | 0.0 /100 | #280 | Tragic 14.2% |
| Hispanics or Latinos | 0.0 /100 | #281 | Tragic 14.2% |
| Spanish Americans | 0.0 /100 | #282 | Tragic 14.2% |
| Yaqui | 0.0 /100 | #283 | Tragic 14.2% |
| Immigrants | Bahamas | 0.0 /100 | #284 | Tragic 14.4% |
| French | 0.0 /100 | #285 | Tragic 14.4% |
| Celtics | 0.0 /100 | #286 | Tragic 14.5% |
| Iroquois | 0.0 /100 | #287 | Tragic 14.5% |
| Whites/Caucasians | 0.0 /100 | #288 | Tragic 14.5% |
| Immigrants | Dominica | 0.0 /100 | #289 | Tragic 14.5% |
| U.S. Virgin Islanders | 0.0 /100 | #290 | Tragic 14.5% |