Hopi vs Yaqui Single Male Poverty
COMPARE
Hopi
Yaqui
Single Male Poverty
Single Male Poverty Comparison
Hopi
Yaqui
27.5%
SINGLE MALE POVERTY
0.0/ 100
METRIC RATING
346th/ 347
METRIC RANK
14.2%
SINGLE MALE POVERTY
0.0/ 100
METRIC RATING
283rd/ 347
METRIC RANK
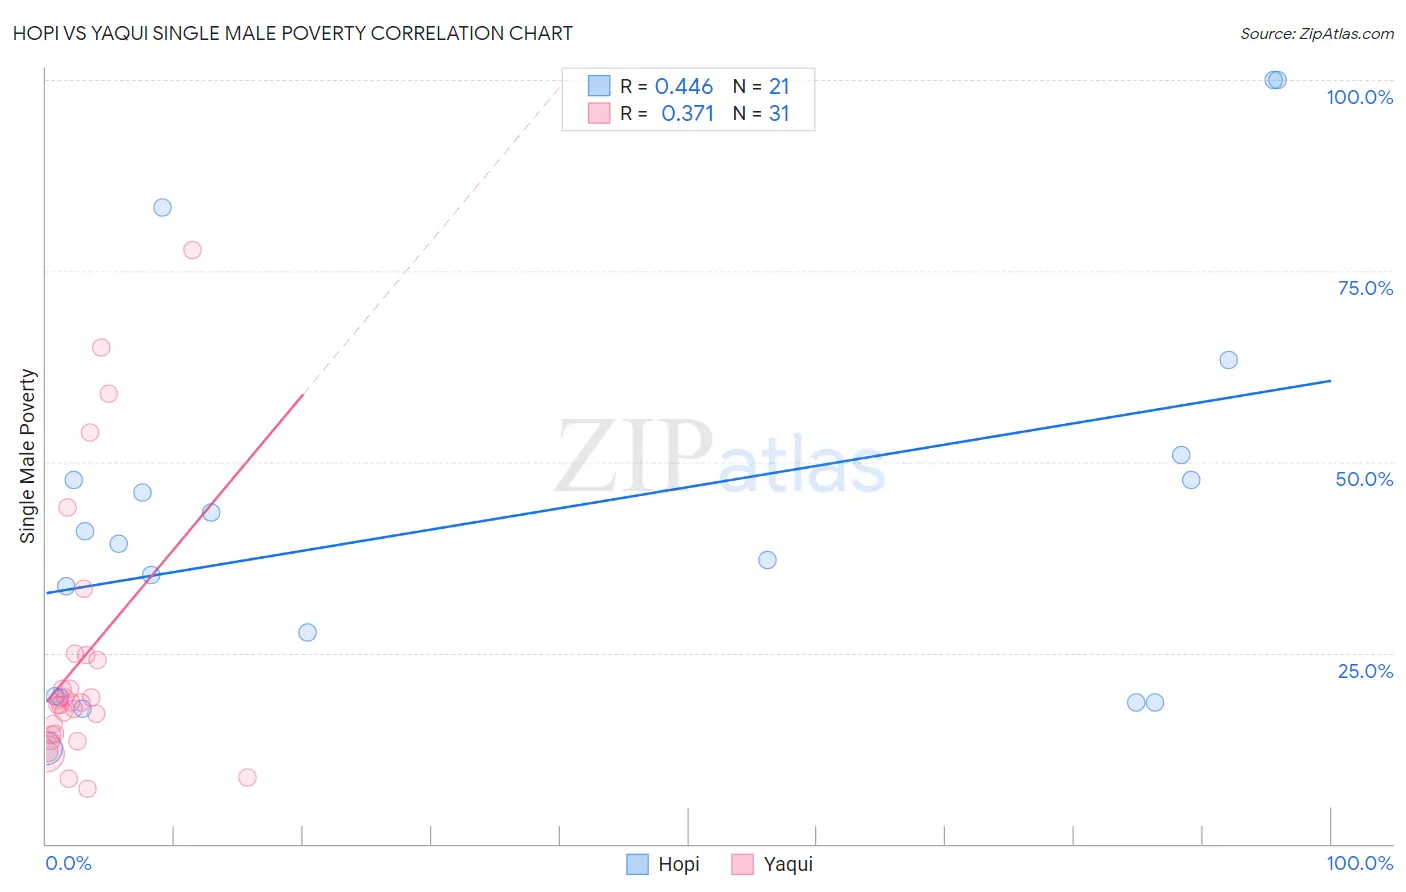
Hopi vs Yaqui Single Male Poverty Correlation Chart
The statistical analysis conducted on geographies consisting of 72,721,636 people shows a moderate positive correlation between the proportion of Hopi and poverty level among single males in the United States with a correlation coefficient (R) of 0.446 and weighted average of 27.5%. Similarly, the statistical analysis conducted on geographies consisting of 103,533,102 people shows a mild positive correlation between the proportion of Yaqui and poverty level among single males in the United States with a correlation coefficient (R) of 0.371 and weighted average of 14.2%, a difference of 93.0%.
Single Male Poverty Correlation Summary
| Measurement | Hopi | Yaqui |
| Minimum | 12.4% | 7.2% |
| Maximum | 100.0% | 77.8% |
| Range | 87.6% | 70.6% |
| Mean | 42.9% | 24.1% |
| Median | 39.3% | 18.4% |
| Interquartile 25% (IQ1) | 19.3% | 14.2% |
| Interquartile 75% (IQ3) | 49.3% | 24.8% |
| Interquartile Range (IQR) | 30.0% | 10.5% |
| Standard Deviation (Sample) | 25.5% | 17.4% |
| Standard Deviation (Population) | 24.9% | 17.1% |
Similar Demographics by Single Male Poverty
Demographics Similar to Hopi by Single Male Poverty
In terms of single male poverty, the demographic groups most similar to Hopi are Navajo (25.3%, a difference of 8.5%), Lumbee (25.2%, a difference of 9.3%), Puerto Rican (25.1%, a difference of 9.7%), Yup'ik (31.6%, a difference of 15.0%), and Houma (23.5%, a difference of 17.3%).
| Demographics | Rating | Rank | Single Male Poverty |
| Inupiat | 0.0 /100 | #333 | Tragic 20.0% |
| Pima | 0.0 /100 | #334 | Tragic 20.2% |
| Yuman | 0.0 /100 | #335 | Tragic 21.3% |
| Tohono O'odham | 0.0 /100 | #336 | Tragic 21.6% |
| Apache | 0.0 /100 | #337 | Tragic 21.6% |
| Pueblo | 0.0 /100 | #338 | Tragic 21.6% |
| Arapaho | 0.0 /100 | #339 | Tragic 21.9% |
| Sioux | 0.0 /100 | #340 | Tragic 22.2% |
| Crow | 0.0 /100 | #341 | Tragic 23.3% |
| Houma | 0.0 /100 | #342 | Tragic 23.5% |
| Puerto Ricans | 0.0 /100 | #343 | Tragic 25.1% |
| Lumbee | 0.0 /100 | #344 | Tragic 25.2% |
| Navajo | 0.0 /100 | #345 | Tragic 25.3% |
| Hopi | 0.0 /100 | #346 | Tragic 27.5% |
| Yup'ik | 0.0 /100 | #347 | Tragic 31.6% |
Demographics Similar to Yaqui by Single Male Poverty
In terms of single male poverty, the demographic groups most similar to Yaqui are Spanish American (14.2%, a difference of 0.16%), Hispanic or Latino (14.2%, a difference of 0.32%), Hmong (14.2%, a difference of 0.34%), Indonesian (14.1%, a difference of 1.1%), and Slovak (14.1%, a difference of 1.1%).
| Demographics | Rating | Rank | Single Male Poverty |
| Dutch | 0.1 /100 | #276 | Tragic 14.1% |
| Immigrants | Honduras | 0.0 /100 | #277 | Tragic 14.1% |
| Slovaks | 0.0 /100 | #278 | Tragic 14.1% |
| Indonesians | 0.0 /100 | #279 | Tragic 14.1% |
| Hmong | 0.0 /100 | #280 | Tragic 14.2% |
| Hispanics or Latinos | 0.0 /100 | #281 | Tragic 14.2% |
| Spanish Americans | 0.0 /100 | #282 | Tragic 14.2% |
| Yaqui | 0.0 /100 | #283 | Tragic 14.2% |
| Immigrants | Bahamas | 0.0 /100 | #284 | Tragic 14.4% |
| French | 0.0 /100 | #285 | Tragic 14.4% |
| Celtics | 0.0 /100 | #286 | Tragic 14.5% |
| Iroquois | 0.0 /100 | #287 | Tragic 14.5% |
| Whites/Caucasians | 0.0 /100 | #288 | Tragic 14.5% |
| Immigrants | Dominica | 0.0 /100 | #289 | Tragic 14.5% |
| U.S. Virgin Islanders | 0.0 /100 | #290 | Tragic 14.5% |