Osage vs Yaqui Ambulatory Disability
COMPARE
Osage
Yaqui
Ambulatory Disability
Ambulatory Disability Comparison
Osage
Yaqui
7.4%
AMBULATORY DISABILITY
0.0/ 100
METRIC RATING
322nd/ 347
METRIC RANK
6.8%
AMBULATORY DISABILITY
0.0/ 100
METRIC RATING
281st/ 347
METRIC RANK
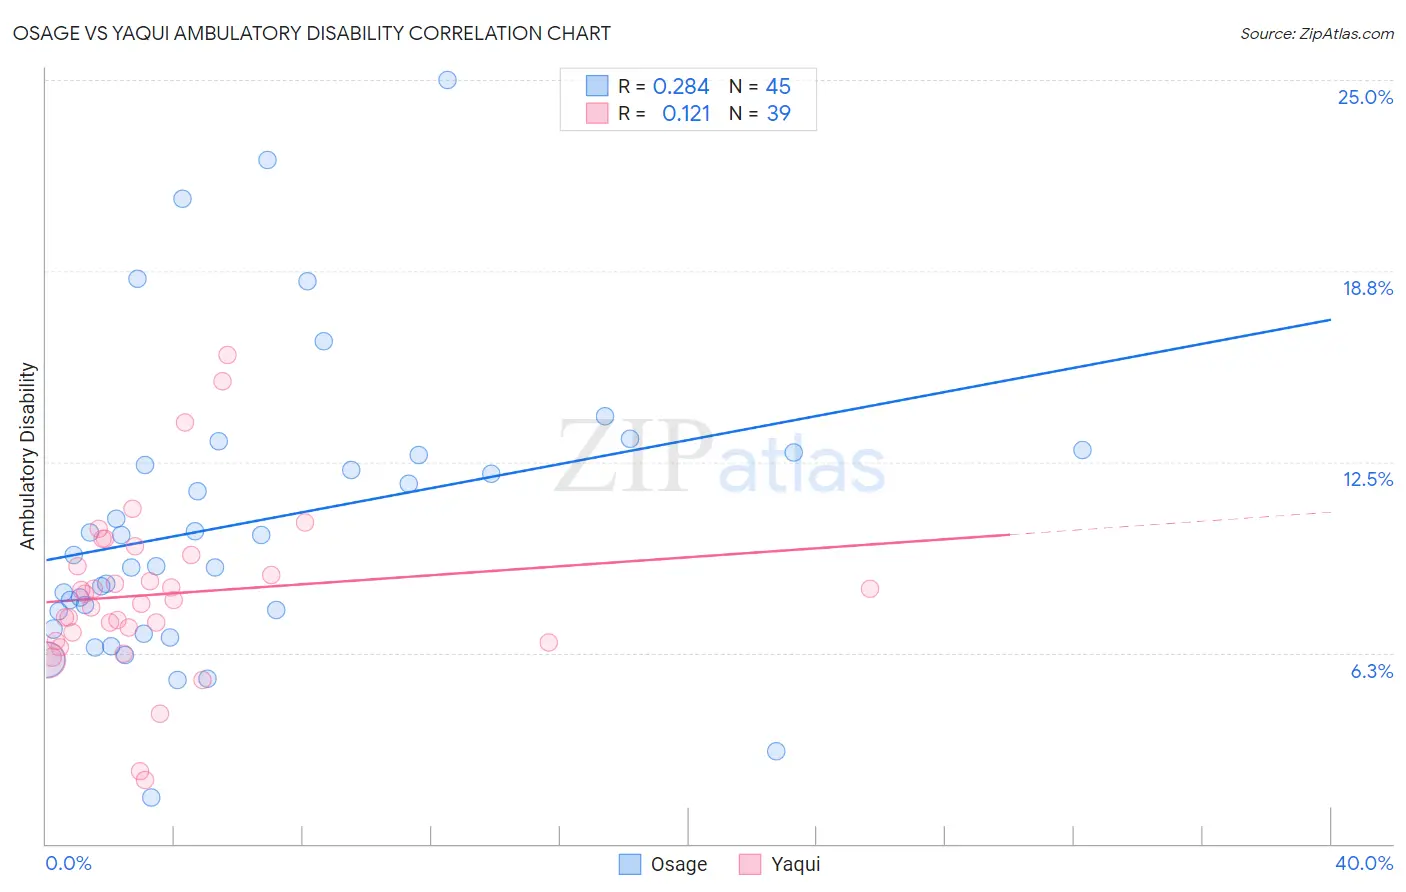
Osage vs Yaqui Ambulatory Disability Correlation Chart
The statistical analysis conducted on geographies consisting of 91,795,743 people shows a weak positive correlation between the proportion of Osage and percentage of population with ambulatory disability in the United States with a correlation coefficient (R) of 0.284 and weighted average of 7.4%. Similarly, the statistical analysis conducted on geographies consisting of 107,720,926 people shows a poor positive correlation between the proportion of Yaqui and percentage of population with ambulatory disability in the United States with a correlation coefficient (R) of 0.121 and weighted average of 6.8%, a difference of 9.3%.
Ambulatory Disability Correlation Summary
| Measurement | Osage | Yaqui |
| Minimum | 1.5% | 2.1% |
| Maximum | 25.0% | 16.0% |
| Range | 23.5% | 13.9% |
| Mean | 10.5% | 8.2% |
| Median | 9.5% | 8.0% |
| Interquartile 25% (IQ1) | 7.3% | 6.6% |
| Interquartile 75% (IQ3) | 12.8% | 9.4% |
| Interquartile Range (IQR) | 5.5% | 2.8% |
| Standard Deviation (Sample) | 4.9% | 2.8% |
| Standard Deviation (Population) | 4.8% | 2.7% |
Similar Demographics by Ambulatory Disability
Demographics Similar to Osage by Ambulatory Disability
In terms of ambulatory disability, the demographic groups most similar to Osage are Apache (7.4%, a difference of 0.14%), American (7.4%, a difference of 0.28%), Potawatomi (7.3%, a difference of 0.95%), Navajo (7.5%, a difference of 1.6%), and Comanche (7.5%, a difference of 1.7%).
| Demographics | Rating | Rank | Ambulatory Disability |
| Shoshone | 0.0 /100 | #315 | Tragic 7.1% |
| Immigrants | Dominican Republic | 0.0 /100 | #316 | Tragic 7.1% |
| Central American Indians | 0.0 /100 | #317 | Tragic 7.2% |
| Ottawa | 0.0 /100 | #318 | Tragic 7.2% |
| Dominicans | 0.0 /100 | #319 | Tragic 7.2% |
| Potawatomi | 0.0 /100 | #320 | Tragic 7.3% |
| Apache | 0.0 /100 | #321 | Tragic 7.4% |
| Osage | 0.0 /100 | #322 | Tragic 7.4% |
| Americans | 0.0 /100 | #323 | Tragic 7.4% |
| Navajo | 0.0 /100 | #324 | Tragic 7.5% |
| Comanche | 0.0 /100 | #325 | Tragic 7.5% |
| Blacks/African Americans | 0.0 /100 | #326 | Tragic 7.5% |
| Natives/Alaskans | 0.0 /100 | #327 | Tragic 7.5% |
| Hopi | 0.0 /100 | #328 | Tragic 7.6% |
| Pueblo | 0.0 /100 | #329 | Tragic 7.6% |
Demographics Similar to Yaqui by Ambulatory Disability
In terms of ambulatory disability, the demographic groups most similar to Yaqui are Pennsylvania German (6.8%, a difference of 0.070%), Barbadian (6.8%, a difference of 0.13%), Immigrants from Caribbean (6.7%, a difference of 0.17%), Immigrants from Barbados (6.8%, a difference of 0.28%), and Immigrants from Jamaica (6.8%, a difference of 0.35%).
| Demographics | Rating | Rank | Ambulatory Disability |
| Sioux | 0.1 /100 | #274 | Tragic 6.7% |
| Immigrants | Guyana | 0.1 /100 | #275 | Tragic 6.7% |
| Celtics | 0.1 /100 | #276 | Tragic 6.7% |
| Jamaicans | 0.1 /100 | #277 | Tragic 6.7% |
| Immigrants | West Indies | 0.1 /100 | #278 | Tragic 6.7% |
| Immigrants | Caribbean | 0.0 /100 | #279 | Tragic 6.7% |
| Pennsylvania Germans | 0.0 /100 | #280 | Tragic 6.8% |
| Yaqui | 0.0 /100 | #281 | Tragic 6.8% |
| Barbadians | 0.0 /100 | #282 | Tragic 6.8% |
| Immigrants | Barbados | 0.0 /100 | #283 | Tragic 6.8% |
| Immigrants | Jamaica | 0.0 /100 | #284 | Tragic 6.8% |
| Fijians | 0.0 /100 | #285 | Tragic 6.8% |
| Yakama | 0.0 /100 | #286 | Tragic 6.8% |
| U.S. Virgin Islanders | 0.0 /100 | #287 | Tragic 6.8% |
| Immigrants | Nonimmigrants | 0.0 /100 | #288 | Tragic 6.9% |