Osage vs Immigrants from Ghana Single Male Poverty
COMPARE
Osage
Immigrants from Ghana
Single Male Poverty
Single Male Poverty Comparison
Osage
Immigrants from Ghana
16.5%
SINGLE MALE POVERTY
0.0/ 100
METRIC RATING
321st/ 347
METRIC RANK
13.4%
SINGLE MALE POVERTY
3.2/ 100
METRIC RATING
238th/ 347
METRIC RANK
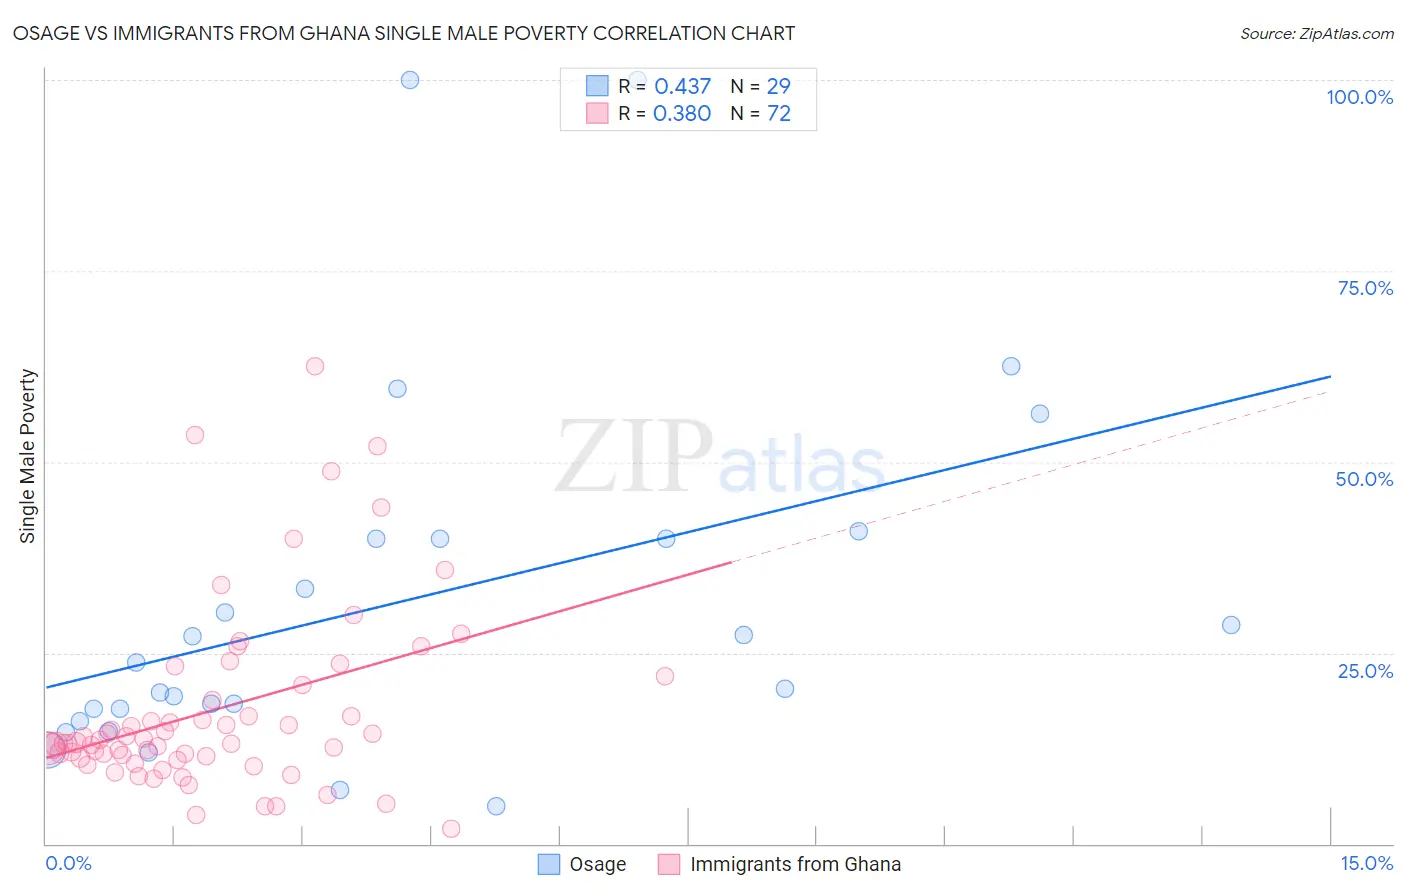
Osage vs Immigrants from Ghana Single Male Poverty Correlation Chart
The statistical analysis conducted on geographies consisting of 87,587,587 people shows a moderate positive correlation between the proportion of Osage and poverty level among single males in the United States with a correlation coefficient (R) of 0.437 and weighted average of 16.5%. Similarly, the statistical analysis conducted on geographies consisting of 185,985,672 people shows a mild positive correlation between the proportion of Immigrants from Ghana and poverty level among single males in the United States with a correlation coefficient (R) of 0.380 and weighted average of 13.4%, a difference of 23.1%.
Single Male Poverty Correlation Summary
| Measurement | Osage | Immigrants from Ghana |
| Minimum | 5.0% | 2.0% |
| Maximum | 100.0% | 62.5% |
| Range | 95.0% | 60.5% |
| Mean | 31.8% | 17.5% |
| Median | 23.8% | 13.2% |
| Interquartile 25% (IQ1) | 16.9% | 11.3% |
| Interquartile 75% (IQ3) | 40.0% | 19.8% |
| Interquartile Range (IQR) | 23.1% | 8.5% |
| Standard Deviation (Sample) | 24.0% | 12.1% |
| Standard Deviation (Population) | 23.6% | 12.0% |
Similar Demographics by Single Male Poverty
Demographics Similar to Osage by Single Male Poverty
In terms of single male poverty, the demographic groups most similar to Osage are Marshallese (16.4%, a difference of 0.13%), Chippewa (16.4%, a difference of 0.61%), Chickasaw (16.3%, a difference of 0.91%), Shoshone (16.7%, a difference of 1.3%), and Black/African American (16.2%, a difference of 1.7%).
| Demographics | Rating | Rank | Single Male Poverty |
| Alaskan Athabascans | 0.0 /100 | #314 | Tragic 16.1% |
| Cheyenne | 0.0 /100 | #315 | Tragic 16.1% |
| Dutch West Indians | 0.0 /100 | #316 | Tragic 16.1% |
| Blacks/African Americans | 0.0 /100 | #317 | Tragic 16.2% |
| Chickasaw | 0.0 /100 | #318 | Tragic 16.3% |
| Chippewa | 0.0 /100 | #319 | Tragic 16.4% |
| Marshallese | 0.0 /100 | #320 | Tragic 16.4% |
| Osage | 0.0 /100 | #321 | Tragic 16.5% |
| Shoshone | 0.0 /100 | #322 | Tragic 16.7% |
| Creek | 0.0 /100 | #323 | Tragic 16.8% |
| Immigrants | Yemen | 0.0 /100 | #324 | Tragic 16.9% |
| Choctaw | 0.0 /100 | #325 | Tragic 17.0% |
| Central American Indians | 0.0 /100 | #326 | Tragic 17.2% |
| Menominee | 0.0 /100 | #327 | Tragic 17.7% |
| Kiowa | 0.0 /100 | #328 | Tragic 18.3% |
Demographics Similar to Immigrants from Ghana by Single Male Poverty
In terms of single male poverty, the demographic groups most similar to Immigrants from Ghana are Czechoslovakian (13.4%, a difference of 0.080%), British West Indian (13.4%, a difference of 0.10%), Luxembourger (13.4%, a difference of 0.16%), Bangladeshi (13.3%, a difference of 0.21%), and British (13.3%, a difference of 0.31%).
| Demographics | Rating | Rank | Single Male Poverty |
| Slavs | 5.3 /100 | #231 | Tragic 13.3% |
| Immigrants | Caribbean | 5.0 /100 | #232 | Tragic 13.3% |
| British | 4.0 /100 | #233 | Tragic 13.3% |
| Canadians | 4.0 /100 | #234 | Tragic 13.3% |
| Bangladeshis | 3.7 /100 | #235 | Tragic 13.3% |
| Luxembourgers | 3.6 /100 | #236 | Tragic 13.4% |
| British West Indians | 3.4 /100 | #237 | Tragic 13.4% |
| Immigrants | Ghana | 3.2 /100 | #238 | Tragic 13.4% |
| Czechoslovakians | 3.0 /100 | #239 | Tragic 13.4% |
| Belizeans | 2.3 /100 | #240 | Tragic 13.4% |
| Immigrants | Germany | 2.1 /100 | #241 | Tragic 13.4% |
| Carpatho Rusyns | 2.1 /100 | #242 | Tragic 13.4% |
| Barbadians | 2.1 /100 | #243 | Tragic 13.4% |
| Immigrants | Senegal | 1.7 /100 | #244 | Tragic 13.5% |
| Immigrants | Latin America | 1.3 /100 | #245 | Tragic 13.5% |