Nigerian vs Immigrants from Ghana Single Male Poverty
COMPARE
Nigerian
Immigrants from Ghana
Single Male Poverty
Single Male Poverty Comparison
Nigerians
Immigrants from Ghana
12.9%
SINGLE MALE POVERTY
31.9/ 100
METRIC RATING
186th/ 347
METRIC RANK
13.4%
SINGLE MALE POVERTY
3.2/ 100
METRIC RATING
238th/ 347
METRIC RANK
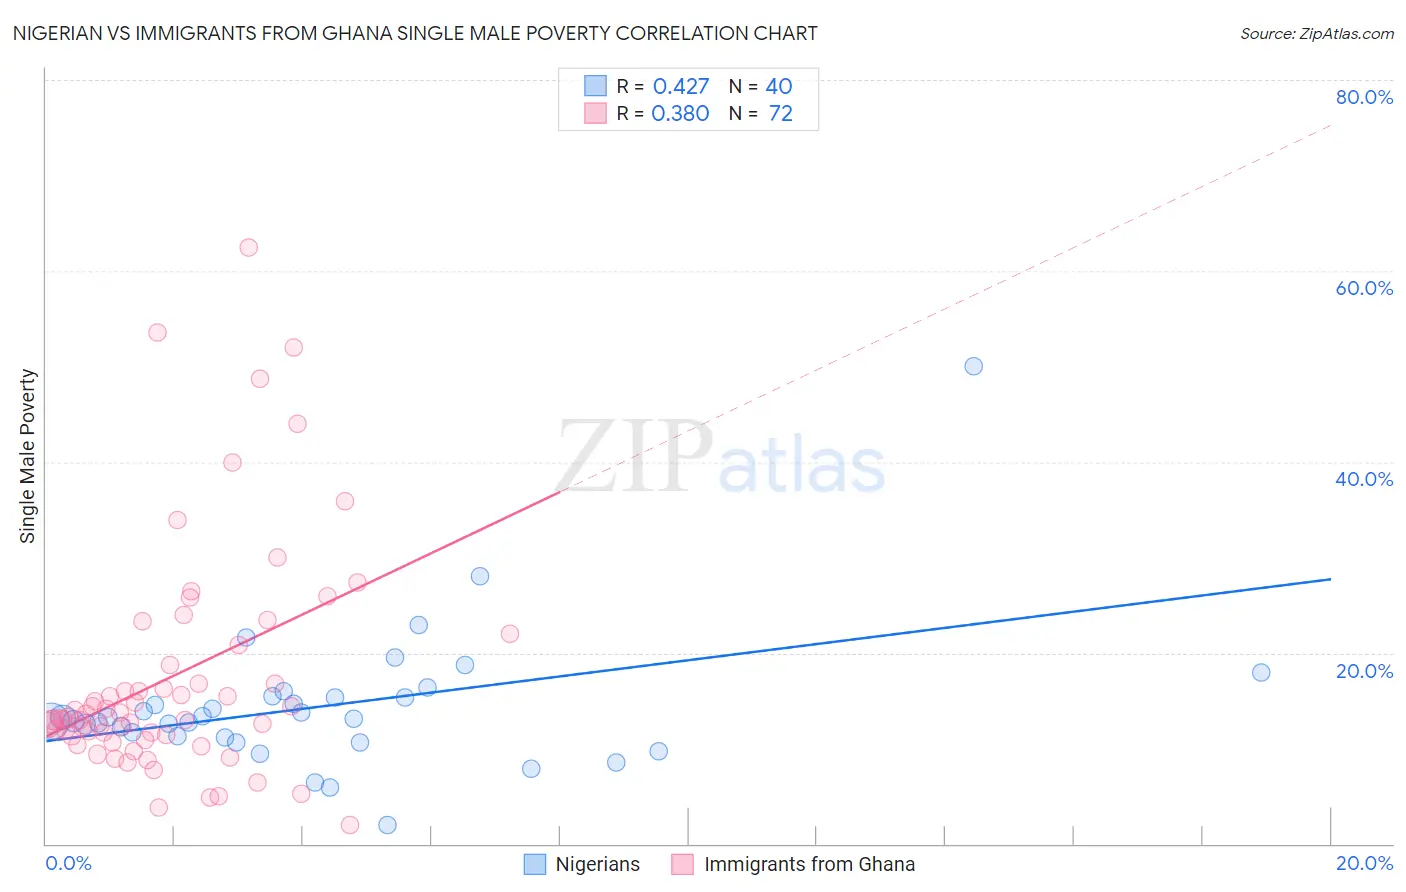
Nigerian vs Immigrants from Ghana Single Male Poverty Correlation Chart
The statistical analysis conducted on geographies consisting of 304,027,429 people shows a moderate positive correlation between the proportion of Nigerians and poverty level among single males in the United States with a correlation coefficient (R) of 0.427 and weighted average of 12.9%. Similarly, the statistical analysis conducted on geographies consisting of 185,985,672 people shows a mild positive correlation between the proportion of Immigrants from Ghana and poverty level among single males in the United States with a correlation coefficient (R) of 0.380 and weighted average of 13.4%, a difference of 3.5%.
Single Male Poverty Correlation Summary
| Measurement | Nigerian | Immigrants from Ghana |
| Minimum | 1.9% | 2.0% |
| Maximum | 50.0% | 62.5% |
| Range | 48.1% | 60.5% |
| Mean | 14.4% | 17.5% |
| Median | 13.2% | 13.2% |
| Interquartile 25% (IQ1) | 11.2% | 11.3% |
| Interquartile 75% (IQ3) | 15.4% | 19.8% |
| Interquartile Range (IQR) | 4.2% | 8.5% |
| Standard Deviation (Sample) | 7.4% | 12.1% |
| Standard Deviation (Population) | 7.3% | 12.0% |
Similar Demographics by Single Male Poverty
Demographics Similar to Nigerians by Single Male Poverty
In terms of single male poverty, the demographic groups most similar to Nigerians are Norwegian (12.9%, a difference of 0.0%), Immigrants from Kuwait (12.9%, a difference of 0.0%), Immigrants from Trinidad and Tobago (12.9%, a difference of 0.030%), Macedonian (12.9%, a difference of 0.030%), and Immigrants from West Indies (12.9%, a difference of 0.060%).
| Demographics | Rating | Rank | Single Male Poverty |
| Israelis | 41.0 /100 | #179 | Average 12.9% |
| Immigrants | North America | 37.7 /100 | #180 | Fair 12.9% |
| Panamanians | 37.6 /100 | #181 | Fair 12.9% |
| Moroccans | 36.8 /100 | #182 | Fair 12.9% |
| Immigrants | West Indies | 33.0 /100 | #183 | Fair 12.9% |
| Immigrants | Trinidad and Tobago | 32.5 /100 | #184 | Fair 12.9% |
| Norwegians | 32.0 /100 | #185 | Fair 12.9% |
| Nigerians | 31.9 /100 | #186 | Fair 12.9% |
| Immigrants | Kuwait | 31.9 /100 | #187 | Fair 12.9% |
| Macedonians | 31.5 /100 | #188 | Fair 12.9% |
| Portuguese | 30.2 /100 | #189 | Fair 12.9% |
| Arabs | 27.0 /100 | #190 | Fair 13.0% |
| Immigrants | Thailand | 26.6 /100 | #191 | Fair 13.0% |
| Immigrants | Jamaica | 26.5 /100 | #192 | Fair 13.0% |
| Immigrants | South Africa | 26.1 /100 | #193 | Fair 13.0% |
Demographics Similar to Immigrants from Ghana by Single Male Poverty
In terms of single male poverty, the demographic groups most similar to Immigrants from Ghana are Czechoslovakian (13.4%, a difference of 0.080%), British West Indian (13.4%, a difference of 0.10%), Luxembourger (13.4%, a difference of 0.16%), Bangladeshi (13.3%, a difference of 0.21%), and British (13.3%, a difference of 0.31%).
| Demographics | Rating | Rank | Single Male Poverty |
| Slavs | 5.3 /100 | #231 | Tragic 13.3% |
| Immigrants | Caribbean | 5.0 /100 | #232 | Tragic 13.3% |
| British | 4.0 /100 | #233 | Tragic 13.3% |
| Canadians | 4.0 /100 | #234 | Tragic 13.3% |
| Bangladeshis | 3.7 /100 | #235 | Tragic 13.3% |
| Luxembourgers | 3.6 /100 | #236 | Tragic 13.4% |
| British West Indians | 3.4 /100 | #237 | Tragic 13.4% |
| Immigrants | Ghana | 3.2 /100 | #238 | Tragic 13.4% |
| Czechoslovakians | 3.0 /100 | #239 | Tragic 13.4% |
| Belizeans | 2.3 /100 | #240 | Tragic 13.4% |
| Immigrants | Germany | 2.1 /100 | #241 | Tragic 13.4% |
| Carpatho Rusyns | 2.1 /100 | #242 | Tragic 13.4% |
| Barbadians | 2.1 /100 | #243 | Tragic 13.4% |
| Immigrants | Senegal | 1.7 /100 | #244 | Tragic 13.5% |
| Immigrants | Latin America | 1.3 /100 | #245 | Tragic 13.5% |