Osage vs Immigrants from Ghana No Vehicles in Household
COMPARE
Osage
Immigrants from Ghana
No Vehicles in Household
No Vehicles in Household Comparison
Osage
Immigrants from Ghana
8.7%
NO VEHICLES IN HOUSEHOLD
99.2/ 100
METRIC RATING
88th/ 347
METRIC RANK
16.6%
NO VEHICLES IN HOUSEHOLD
0.0/ 100
METRIC RATING
317th/ 347
METRIC RANK
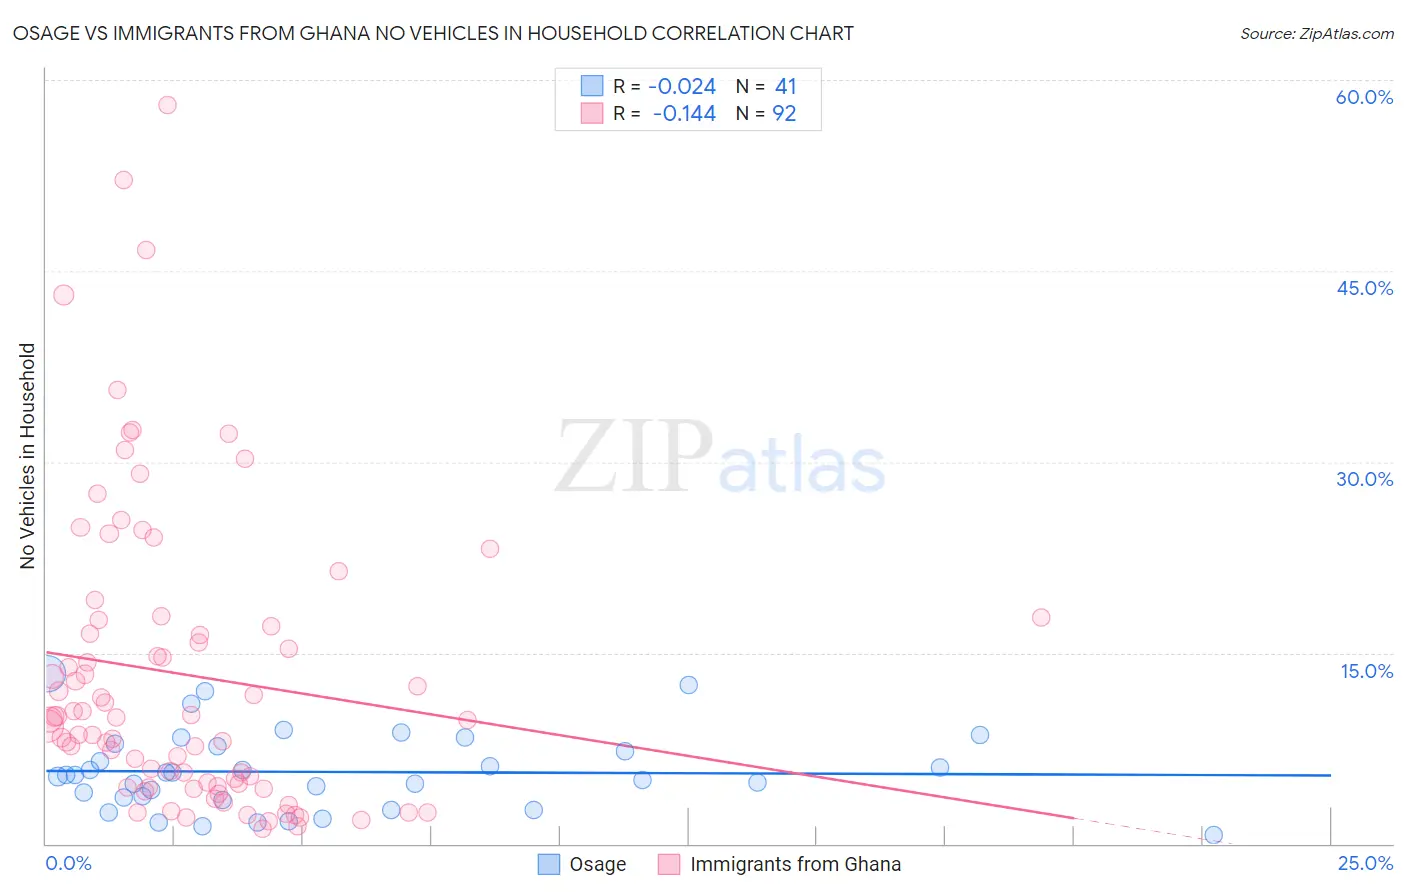
Osage vs Immigrants from Ghana No Vehicles in Household Correlation Chart
The statistical analysis conducted on geographies consisting of 91,756,472 people shows no correlation between the proportion of Osage and percentage of households with no vehicle available in the United States with a correlation coefficient (R) of -0.024 and weighted average of 8.7%. Similarly, the statistical analysis conducted on geographies consisting of 199,471,025 people shows a poor negative correlation between the proportion of Immigrants from Ghana and percentage of households with no vehicle available in the United States with a correlation coefficient (R) of -0.144 and weighted average of 16.6%, a difference of 90.9%.
No Vehicles in Household Correlation Summary
| Measurement | Osage | Immigrants from Ghana |
| Minimum | 0.66% | 1.2% |
| Maximum | 13.3% | 58.0% |
| Range | 12.7% | 56.8% |
| Mean | 5.6% | 13.3% |
| Median | 5.4% | 9.8% |
| Interquartile 25% (IQ1) | 3.5% | 4.6% |
| Interquartile 75% (IQ3) | 7.7% | 17.3% |
| Interquartile Range (IQR) | 4.2% | 12.7% |
| Standard Deviation (Sample) | 3.1% | 11.8% |
| Standard Deviation (Population) | 3.1% | 11.7% |
Similar Demographics by No Vehicles in Household
Demographics Similar to Osage by No Vehicles in Household
In terms of no vehicles in household, the demographic groups most similar to Osage are Immigrants from England (8.7%, a difference of 0.12%), Immigrants from Cuba (8.7%, a difference of 0.14%), Bhutanese (8.7%, a difference of 0.23%), Bangladeshi (8.7%, a difference of 0.34%), and Immigrants from Germany (8.7%, a difference of 0.42%).
| Demographics | Rating | Rank | No Vehicles in Household |
| Tsimshian | 99.4 /100 | #81 | Exceptional 8.6% |
| Immigrants | South Eastern Asia | 99.4 /100 | #82 | Exceptional 8.6% |
| Italians | 99.4 /100 | #83 | Exceptional 8.6% |
| Immigrants | Jordan | 99.3 /100 | #84 | Exceptional 8.7% |
| Lebanese | 99.3 /100 | #85 | Exceptional 8.7% |
| Bangladeshis | 99.3 /100 | #86 | Exceptional 8.7% |
| Immigrants | England | 99.2 /100 | #87 | Exceptional 8.7% |
| Osage | 99.2 /100 | #88 | Exceptional 8.7% |
| Immigrants | Cuba | 99.2 /100 | #89 | Exceptional 8.7% |
| Bhutanese | 99.2 /100 | #90 | Exceptional 8.7% |
| Immigrants | Germany | 99.1 /100 | #91 | Exceptional 8.7% |
| Immigrants | Canada | 99.1 /100 | #92 | Exceptional 8.7% |
| Immigrants | North America | 99.1 /100 | #93 | Exceptional 8.7% |
| Austrians | 98.9 /100 | #94 | Exceptional 8.8% |
| Potawatomi | 98.8 /100 | #95 | Exceptional 8.8% |
Demographics Similar to Immigrants from Ghana by No Vehicles in Household
In terms of no vehicles in household, the demographic groups most similar to Immigrants from Ghana are Immigrants from Belarus (16.7%, a difference of 0.86%), Ghanaian (16.4%, a difference of 0.95%), Alaska Native (17.4%, a difference of 4.8%), Soviet Union (17.4%, a difference of 5.0%), and Cypriot (15.7%, a difference of 6.0%).
| Demographics | Rating | Rank | No Vehicles in Household |
| Cape Verdeans | 0.0 /100 | #310 | Tragic 15.6% |
| Immigrants | Israel | 0.0 /100 | #311 | Tragic 15.6% |
| Alaskan Athabascans | 0.0 /100 | #312 | Tragic 15.6% |
| Tohono O'odham | 0.0 /100 | #313 | Tragic 15.6% |
| Albanians | 0.0 /100 | #314 | Tragic 15.6% |
| Cypriots | 0.0 /100 | #315 | Tragic 15.7% |
| Ghanaians | 0.0 /100 | #316 | Tragic 16.4% |
| Immigrants | Ghana | 0.0 /100 | #317 | Tragic 16.6% |
| Immigrants | Belarus | 0.0 /100 | #318 | Tragic 16.7% |
| Alaska Natives | 0.0 /100 | #319 | Tragic 17.4% |
| Soviet Union | 0.0 /100 | #320 | Tragic 17.4% |
| Jamaicans | 0.0 /100 | #321 | Tragic 17.9% |
| Immigrants | Cabo Verde | 0.0 /100 | #322 | Tragic 18.4% |
| Immigrants | Yemen | 0.0 /100 | #323 | Tragic 19.5% |
| Immigrants | Caribbean | 0.0 /100 | #324 | Tragic 19.6% |