Houma vs Immigrants from Ghana Single Male Poverty
COMPARE
Houma
Immigrants from Ghana
Single Male Poverty
Single Male Poverty Comparison
Houma
Immigrants from Ghana
23.5%
SINGLE MALE POVERTY
0.0/ 100
METRIC RATING
342nd/ 347
METRIC RANK
13.4%
SINGLE MALE POVERTY
3.2/ 100
METRIC RATING
238th/ 347
METRIC RANK
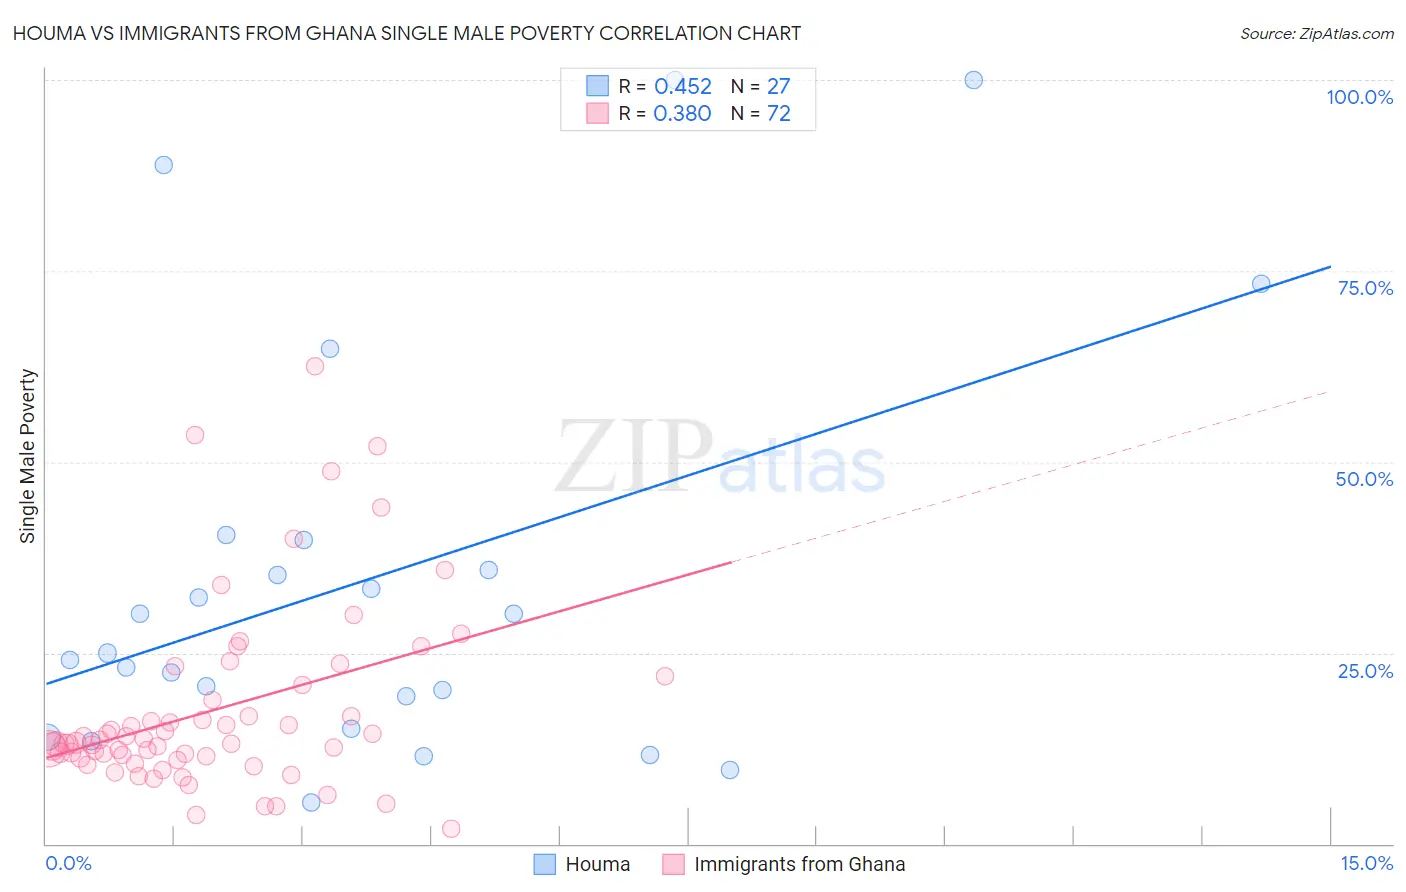
Houma vs Immigrants from Ghana Single Male Poverty Correlation Chart
The statistical analysis conducted on geographies consisting of 35,894,228 people shows a moderate positive correlation between the proportion of Houma and poverty level among single males in the United States with a correlation coefficient (R) of 0.452 and weighted average of 23.5%. Similarly, the statistical analysis conducted on geographies consisting of 185,985,672 people shows a mild positive correlation between the proportion of Immigrants from Ghana and poverty level among single males in the United States with a correlation coefficient (R) of 0.380 and weighted average of 13.4%, a difference of 75.3%.
Single Male Poverty Correlation Summary
| Measurement | Houma | Immigrants from Ghana |
| Minimum | 5.4% | 2.0% |
| Maximum | 100.0% | 62.5% |
| Range | 94.6% | 60.5% |
| Mean | 34.8% | 17.5% |
| Median | 25.0% | 13.2% |
| Interquartile 25% (IQ1) | 15.1% | 11.3% |
| Interquartile 75% (IQ3) | 39.7% | 19.8% |
| Interquartile Range (IQR) | 24.7% | 8.5% |
| Standard Deviation (Sample) | 27.0% | 12.1% |
| Standard Deviation (Population) | 26.5% | 12.0% |
Similar Demographics by Single Male Poverty
Demographics Similar to Houma by Single Male Poverty
In terms of single male poverty, the demographic groups most similar to Houma are Crow (23.3%, a difference of 0.82%), Sioux (22.2%, a difference of 5.6%), Arapaho (21.9%, a difference of 6.9%), Puerto Rican (25.1%, a difference of 6.9%), and Lumbee (25.2%, a difference of 7.3%).
| Demographics | Rating | Rank | Single Male Poverty |
| Inupiat | 0.0 /100 | #333 | Tragic 20.0% |
| Pima | 0.0 /100 | #334 | Tragic 20.2% |
| Yuman | 0.0 /100 | #335 | Tragic 21.3% |
| Tohono O'odham | 0.0 /100 | #336 | Tragic 21.6% |
| Apache | 0.0 /100 | #337 | Tragic 21.6% |
| Pueblo | 0.0 /100 | #338 | Tragic 21.6% |
| Arapaho | 0.0 /100 | #339 | Tragic 21.9% |
| Sioux | 0.0 /100 | #340 | Tragic 22.2% |
| Crow | 0.0 /100 | #341 | Tragic 23.3% |
| Houma | 0.0 /100 | #342 | Tragic 23.5% |
| Puerto Ricans | 0.0 /100 | #343 | Tragic 25.1% |
| Lumbee | 0.0 /100 | #344 | Tragic 25.2% |
| Navajo | 0.0 /100 | #345 | Tragic 25.3% |
| Hopi | 0.0 /100 | #346 | Tragic 27.5% |
| Yup'ik | 0.0 /100 | #347 | Tragic 31.6% |
Demographics Similar to Immigrants from Ghana by Single Male Poverty
In terms of single male poverty, the demographic groups most similar to Immigrants from Ghana are Czechoslovakian (13.4%, a difference of 0.080%), British West Indian (13.4%, a difference of 0.10%), Luxembourger (13.4%, a difference of 0.16%), Bangladeshi (13.3%, a difference of 0.21%), and British (13.3%, a difference of 0.31%).
| Demographics | Rating | Rank | Single Male Poverty |
| Slavs | 5.3 /100 | #231 | Tragic 13.3% |
| Immigrants | Caribbean | 5.0 /100 | #232 | Tragic 13.3% |
| British | 4.0 /100 | #233 | Tragic 13.3% |
| Canadians | 4.0 /100 | #234 | Tragic 13.3% |
| Bangladeshis | 3.7 /100 | #235 | Tragic 13.3% |
| Luxembourgers | 3.6 /100 | #236 | Tragic 13.4% |
| British West Indians | 3.4 /100 | #237 | Tragic 13.4% |
| Immigrants | Ghana | 3.2 /100 | #238 | Tragic 13.4% |
| Czechoslovakians | 3.0 /100 | #239 | Tragic 13.4% |
| Belizeans | 2.3 /100 | #240 | Tragic 13.4% |
| Immigrants | Germany | 2.1 /100 | #241 | Tragic 13.4% |
| Carpatho Rusyns | 2.1 /100 | #242 | Tragic 13.4% |
| Barbadians | 2.1 /100 | #243 | Tragic 13.4% |
| Immigrants | Senegal | 1.7 /100 | #244 | Tragic 13.5% |
| Immigrants | Latin America | 1.3 /100 | #245 | Tragic 13.5% |