Jamaican vs Immigrants from El Salvador Single Female Poverty
COMPARE
Jamaican
Immigrants from El Salvador
Single Female Poverty
Single Female Poverty Comparison
Jamaicans
Immigrants from El Salvador
21.6%
SINGLE FEMALE POVERTY
14.0/ 100
METRIC RATING
212th/ 347
METRIC RANK
22.4%
SINGLE FEMALE POVERTY
1.4/ 100
METRIC RATING
247th/ 347
METRIC RANK
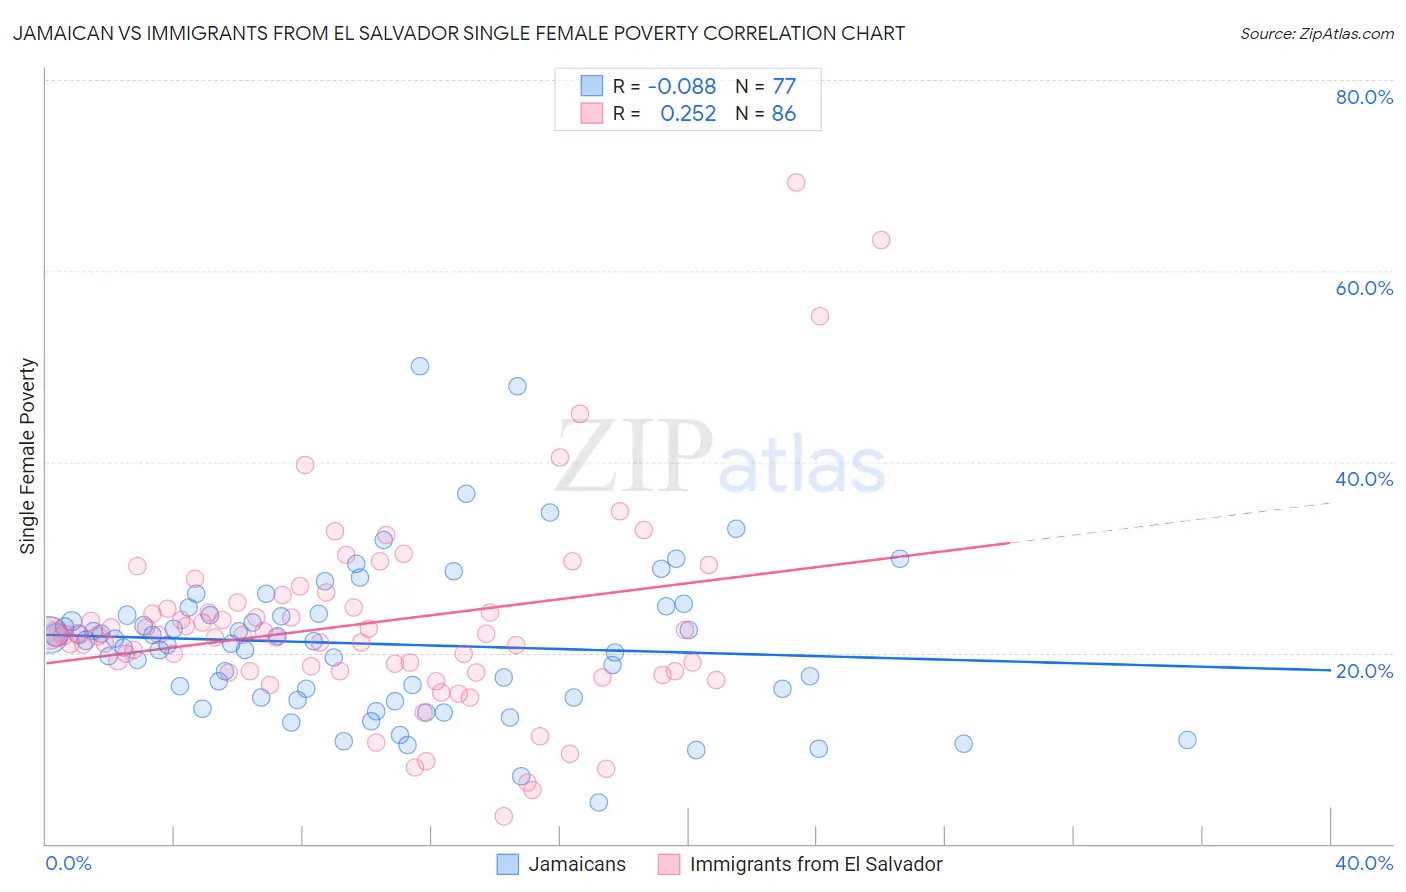
Jamaican vs Immigrants from El Salvador Single Female Poverty Correlation Chart
The statistical analysis conducted on geographies consisting of 363,369,042 people shows a slight negative correlation between the proportion of Jamaicans and poverty level among single females in the United States with a correlation coefficient (R) of -0.088 and weighted average of 21.6%. Similarly, the statistical analysis conducted on geographies consisting of 354,692,834 people shows a weak positive correlation between the proportion of Immigrants from El Salvador and poverty level among single females in the United States with a correlation coefficient (R) of 0.252 and weighted average of 22.4%, a difference of 3.7%.
Single Female Poverty Correlation Summary
| Measurement | Jamaican | Immigrants from El Salvador |
| Minimum | 4.4% | 2.9% |
| Maximum | 50.0% | 69.3% |
| Range | 45.6% | 66.4% |
| Mean | 20.9% | 23.0% |
| Median | 21.2% | 21.9% |
| Interquartile 25% (IQ1) | 15.3% | 18.1% |
| Interquartile 75% (IQ3) | 24.0% | 24.8% |
| Interquartile Range (IQR) | 8.7% | 6.6% |
| Standard Deviation (Sample) | 7.9% | 10.5% |
| Standard Deviation (Population) | 7.9% | 10.5% |
Similar Demographics by Single Female Poverty
Demographics Similar to Jamaicans by Single Female Poverty
In terms of single female poverty, the demographic groups most similar to Jamaicans are Icelander (21.6%, a difference of 0.010%), Guamanian/Chamorro (21.6%, a difference of 0.030%), Immigrants from Panama (21.6%, a difference of 0.050%), Immigrants from Nicaragua (21.6%, a difference of 0.090%), and Immigrants from Eastern Africa (21.6%, a difference of 0.14%).
| Demographics | Rating | Rank | Single Female Poverty |
| Finns | 16.2 /100 | #205 | Poor 21.5% |
| Belgians | 16.1 /100 | #206 | Poor 21.5% |
| Ghanaians | 15.7 /100 | #207 | Poor 21.6% |
| Haitians | 15.4 /100 | #208 | Poor 21.6% |
| Immigrants | Eastern Africa | 15.1 /100 | #209 | Poor 21.6% |
| Immigrants | Panama | 14.4 /100 | #210 | Poor 21.6% |
| Icelanders | 14.0 /100 | #211 | Poor 21.6% |
| Jamaicans | 14.0 /100 | #212 | Poor 21.6% |
| Guamanians/Chamorros | 13.7 /100 | #213 | Poor 21.6% |
| Immigrants | Nicaragua | 13.3 /100 | #214 | Poor 21.6% |
| Ecuadorians | 12.3 /100 | #215 | Poor 21.6% |
| Immigrants | Barbados | 12.2 /100 | #216 | Poor 21.7% |
| Immigrants | St. Vincent and the Grenadines | 11.7 /100 | #217 | Poor 21.7% |
| Nepalese | 9.7 /100 | #218 | Tragic 21.7% |
| Panamanians | 9.4 /100 | #219 | Tragic 21.7% |
Demographics Similar to Immigrants from El Salvador by Single Female Poverty
In terms of single female poverty, the demographic groups most similar to Immigrants from El Salvador are Belizean (22.4%, a difference of 0.010%), Liberian (22.4%, a difference of 0.060%), Immigrants from Caribbean (22.4%, a difference of 0.11%), Immigrants from Bahamas (22.5%, a difference of 0.26%), and Immigrants from West Indies (22.5%, a difference of 0.40%).
| Demographics | Rating | Rank | Single Female Poverty |
| French | 2.3 /100 | #240 | Tragic 22.2% |
| Cape Verdeans | 2.1 /100 | #241 | Tragic 22.3% |
| Bermudans | 2.0 /100 | #242 | Tragic 22.3% |
| West Indians | 1.9 /100 | #243 | Tragic 22.3% |
| Immigrants | Middle Africa | 1.9 /100 | #244 | Tragic 22.3% |
| Immigrants | Bangladesh | 1.8 /100 | #245 | Tragic 22.3% |
| Liberians | 1.4 /100 | #246 | Tragic 22.4% |
| Immigrants | El Salvador | 1.4 /100 | #247 | Tragic 22.4% |
| Belizeans | 1.4 /100 | #248 | Tragic 22.4% |
| Immigrants | Caribbean | 1.3 /100 | #249 | Tragic 22.4% |
| Immigrants | Bahamas | 1.2 /100 | #250 | Tragic 22.5% |
| Immigrants | West Indies | 1.0 /100 | #251 | Tragic 22.5% |
| Delaware | 1.0 /100 | #252 | Tragic 22.5% |
| Immigrants | Liberia | 0.9 /100 | #253 | Tragic 22.5% |
| Immigrants | Burma/Myanmar | 0.8 /100 | #254 | Tragic 22.6% |