Yaqui vs Immigrants from El Salvador Single Female Poverty
COMPARE
Yaqui
Immigrants from El Salvador
Single Female Poverty
Single Female Poverty Comparison
Yaqui
Immigrants from El Salvador
24.9%
SINGLE FEMALE POVERTY
0.0/ 100
METRIC RATING
298th/ 347
METRIC RANK
22.4%
SINGLE FEMALE POVERTY
1.4/ 100
METRIC RATING
247th/ 347
METRIC RANK
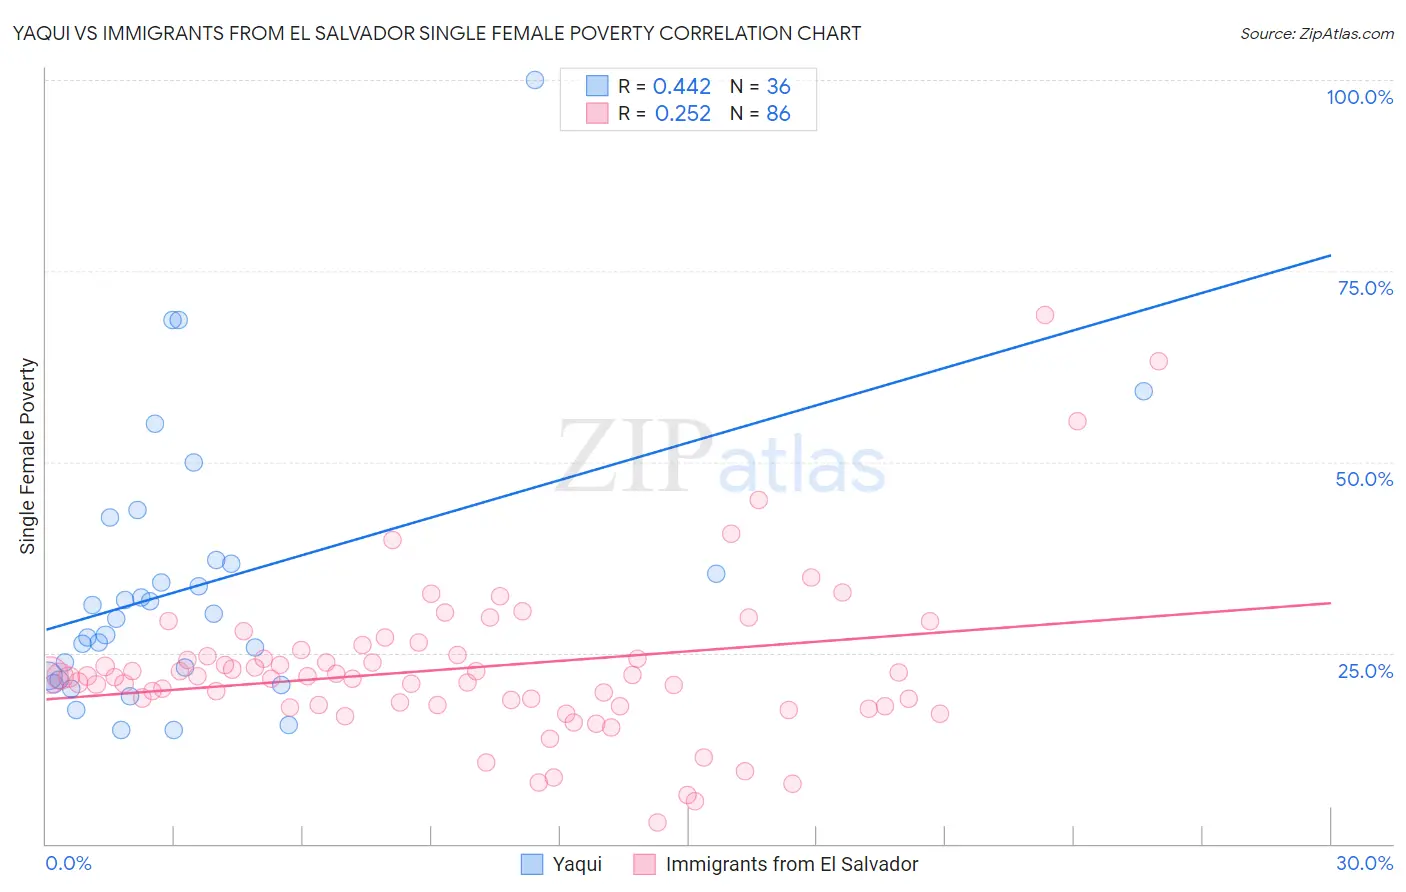
Yaqui vs Immigrants from El Salvador Single Female Poverty Correlation Chart
The statistical analysis conducted on geographies consisting of 107,224,239 people shows a moderate positive correlation between the proportion of Yaqui and poverty level among single females in the United States with a correlation coefficient (R) of 0.442 and weighted average of 24.9%. Similarly, the statistical analysis conducted on geographies consisting of 354,692,834 people shows a weak positive correlation between the proportion of Immigrants from El Salvador and poverty level among single females in the United States with a correlation coefficient (R) of 0.252 and weighted average of 22.4%, a difference of 11.0%.
Single Female Poverty Correlation Summary
| Measurement | Yaqui | Immigrants from El Salvador |
| Minimum | 14.9% | 2.9% |
| Maximum | 100.0% | 69.3% |
| Range | 85.1% | 66.4% |
| Mean | 33.8% | 23.0% |
| Median | 29.7% | 21.9% |
| Interquartile 25% (IQ1) | 21.7% | 18.1% |
| Interquartile 75% (IQ3) | 37.0% | 24.8% |
| Interquartile Range (IQR) | 15.3% | 6.6% |
| Standard Deviation (Sample) | 17.9% | 10.5% |
| Standard Deviation (Population) | 17.7% | 10.5% |
Similar Demographics by Single Female Poverty
Demographics Similar to Yaqui by Single Female Poverty
In terms of single female poverty, the demographic groups most similar to Yaqui are Immigrants from Central America (24.8%, a difference of 0.19%), African (24.8%, a difference of 0.48%), Mexican (25.0%, a difference of 0.67%), Blackfeet (25.1%, a difference of 0.74%), and Honduran (25.1%, a difference of 0.92%).
| Demographics | Rating | Rank | Single Female Poverty |
| Osage | 0.0 /100 | #291 | Tragic 24.4% |
| Alsatians | 0.0 /100 | #292 | Tragic 24.5% |
| Americans | 0.0 /100 | #293 | Tragic 24.5% |
| French American Indians | 0.0 /100 | #294 | Tragic 24.6% |
| Hispanics or Latinos | 0.0 /100 | #295 | Tragic 24.6% |
| Africans | 0.0 /100 | #296 | Tragic 24.8% |
| Immigrants | Central America | 0.0 /100 | #297 | Tragic 24.8% |
| Yaqui | 0.0 /100 | #298 | Tragic 24.9% |
| Mexicans | 0.0 /100 | #299 | Tragic 25.0% |
| Blackfeet | 0.0 /100 | #300 | Tragic 25.1% |
| Hondurans | 0.0 /100 | #301 | Tragic 25.1% |
| Shoshone | 0.0 /100 | #302 | Tragic 25.1% |
| Somalis | 0.0 /100 | #303 | Tragic 25.2% |
| Immigrants | Congo | 0.0 /100 | #304 | Tragic 25.3% |
| Immigrants | Dominican Republic | 0.0 /100 | #305 | Tragic 25.3% |
Demographics Similar to Immigrants from El Salvador by Single Female Poverty
In terms of single female poverty, the demographic groups most similar to Immigrants from El Salvador are Belizean (22.4%, a difference of 0.010%), Liberian (22.4%, a difference of 0.060%), Immigrants from Caribbean (22.4%, a difference of 0.11%), Immigrants from Bahamas (22.5%, a difference of 0.26%), and Immigrants from West Indies (22.5%, a difference of 0.40%).
| Demographics | Rating | Rank | Single Female Poverty |
| French | 2.3 /100 | #240 | Tragic 22.2% |
| Cape Verdeans | 2.1 /100 | #241 | Tragic 22.3% |
| Bermudans | 2.0 /100 | #242 | Tragic 22.3% |
| West Indians | 1.9 /100 | #243 | Tragic 22.3% |
| Immigrants | Middle Africa | 1.9 /100 | #244 | Tragic 22.3% |
| Immigrants | Bangladesh | 1.8 /100 | #245 | Tragic 22.3% |
| Liberians | 1.4 /100 | #246 | Tragic 22.4% |
| Immigrants | El Salvador | 1.4 /100 | #247 | Tragic 22.4% |
| Belizeans | 1.4 /100 | #248 | Tragic 22.4% |
| Immigrants | Caribbean | 1.3 /100 | #249 | Tragic 22.4% |
| Immigrants | Bahamas | 1.2 /100 | #250 | Tragic 22.5% |
| Immigrants | West Indies | 1.0 /100 | #251 | Tragic 22.5% |
| Delaware | 1.0 /100 | #252 | Tragic 22.5% |
| Immigrants | Liberia | 0.9 /100 | #253 | Tragic 22.5% |
| Immigrants | Burma/Myanmar | 0.8 /100 | #254 | Tragic 22.6% |