Iraqi vs Brazilian Single Female Poverty
COMPARE
Iraqi
Brazilian
Single Female Poverty
Single Female Poverty Comparison
Iraqis
Brazilians
20.8%
SINGLE FEMALE POVERTY
64.5/ 100
METRIC RATING
164th/ 347
METRIC RANK
20.1%
SINGLE FEMALE POVERTY
94.4/ 100
METRIC RATING
123rd/ 347
METRIC RANK
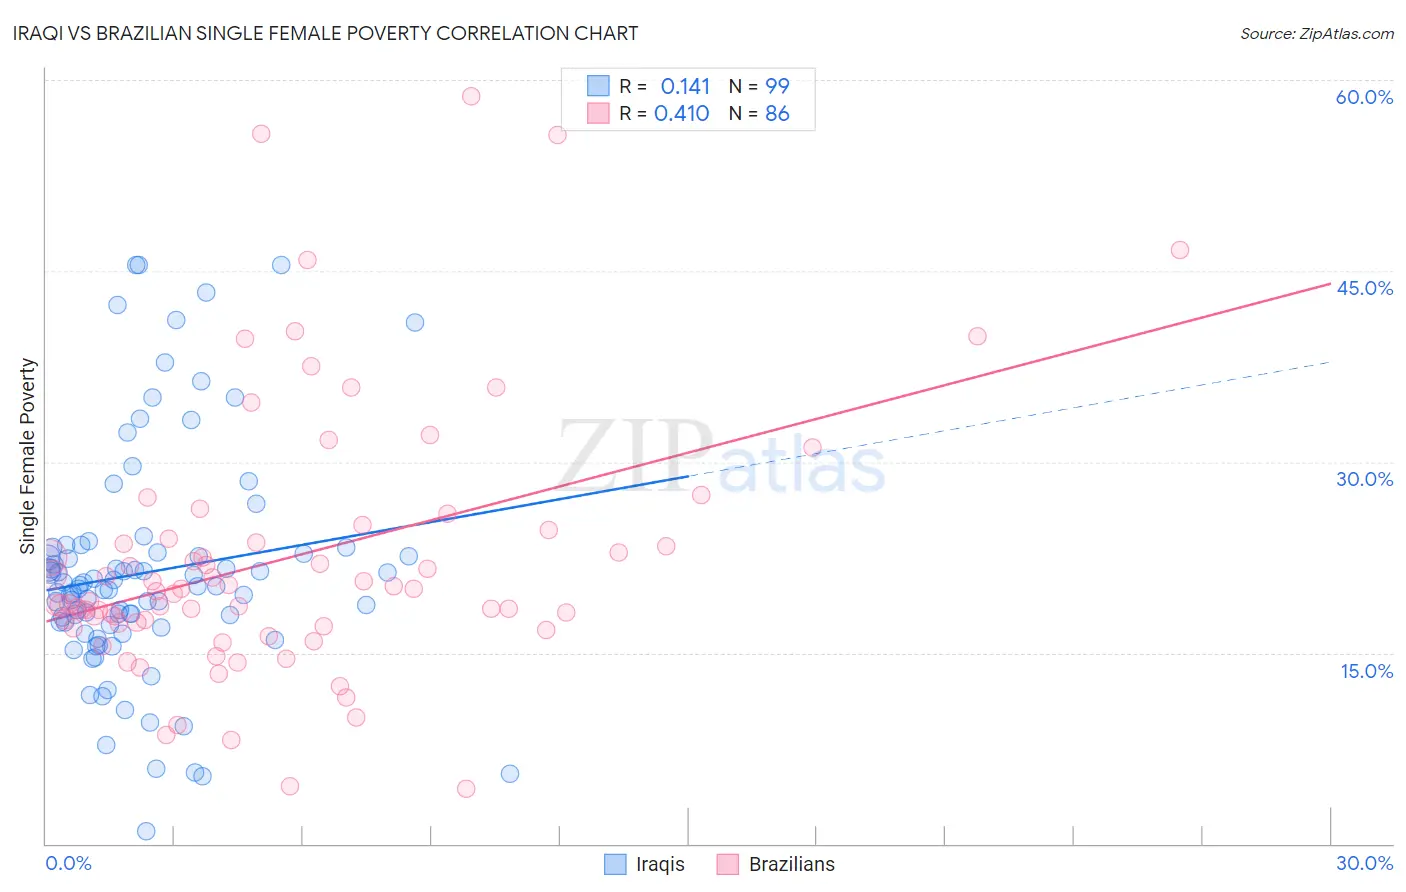
Iraqi vs Brazilian Single Female Poverty Correlation Chart
The statistical analysis conducted on geographies consisting of 169,824,152 people shows a poor positive correlation between the proportion of Iraqis and poverty level among single females in the United States with a correlation coefficient (R) of 0.141 and weighted average of 20.8%. Similarly, the statistical analysis conducted on geographies consisting of 319,523,574 people shows a moderate positive correlation between the proportion of Brazilians and poverty level among single females in the United States with a correlation coefficient (R) of 0.410 and weighted average of 20.1%, a difference of 3.6%.
Single Female Poverty Correlation Summary
| Measurement | Iraqi | Brazilian |
| Minimum | 0.98% | 4.3% |
| Maximum | 45.5% | 58.7% |
| Range | 44.5% | 54.4% |
| Mean | 21.3% | 22.4% |
| Median | 20.2% | 19.7% |
| Interquartile 25% (IQ1) | 17.1% | 17.3% |
| Interquartile 75% (IQ3) | 22.9% | 23.9% |
| Interquartile Range (IQR) | 5.7% | 6.6% |
| Standard Deviation (Sample) | 9.0% | 10.5% |
| Standard Deviation (Population) | 8.9% | 10.4% |
Similar Demographics by Single Female Poverty
Demographics Similar to Iraqis by Single Female Poverty
In terms of single female poverty, the demographic groups most similar to Iraqis are Ugandan (20.8%, a difference of 0.040%), Norwegian (20.8%, a difference of 0.10%), Immigrants from Norway (20.8%, a difference of 0.10%), Immigrants from Costa Rica (20.9%, a difference of 0.20%), and Lebanese (20.8%, a difference of 0.22%).
| Demographics | Rating | Rank | Single Female Poverty |
| Immigrants | Oceania | 74.3 /100 | #157 | Good 20.7% |
| Danes | 73.0 /100 | #158 | Good 20.7% |
| Costa Ricans | 71.8 /100 | #159 | Good 20.7% |
| Arabs | 70.8 /100 | #160 | Good 20.7% |
| Kenyans | 68.5 /100 | #161 | Good 20.8% |
| Northern Europeans | 68.4 /100 | #162 | Good 20.8% |
| Lebanese | 67.6 /100 | #163 | Good 20.8% |
| Iraqis | 64.5 /100 | #164 | Good 20.8% |
| Ugandans | 64.0 /100 | #165 | Good 20.8% |
| Norwegians | 63.0 /100 | #166 | Good 20.8% |
| Immigrants | Norway | 63.0 /100 | #167 | Good 20.8% |
| Immigrants | Costa Rica | 61.5 /100 | #168 | Good 20.9% |
| Immigrants | Trinidad and Tobago | 56.3 /100 | #169 | Average 20.9% |
| New Zealanders | 53.2 /100 | #170 | Average 21.0% |
| Moroccans | 52.8 /100 | #171 | Average 21.0% |
Demographics Similar to Brazilians by Single Female Poverty
In terms of single female poverty, the demographic groups most similar to Brazilians are Immigrants from Chile (20.1%, a difference of 0.030%), Immigrants from South Africa (20.1%, a difference of 0.15%), Immigrants from South America (20.0%, a difference of 0.18%), Immigrants from Switzerland (20.0%, a difference of 0.21%), and South American (20.0%, a difference of 0.24%).
| Demographics | Rating | Rank | Single Female Poverty |
| Immigrants | Kazakhstan | 95.7 /100 | #116 | Exceptional 20.0% |
| Poles | 95.6 /100 | #117 | Exceptional 20.0% |
| Immigrants | Afghanistan | 95.4 /100 | #118 | Exceptional 20.0% |
| Immigrants | Ethiopia | 95.4 /100 | #119 | Exceptional 20.0% |
| South Americans | 95.1 /100 | #120 | Exceptional 20.0% |
| Immigrants | Switzerland | 95.1 /100 | #121 | Exceptional 20.0% |
| Immigrants | South America | 95.0 /100 | #122 | Exceptional 20.0% |
| Brazilians | 94.4 /100 | #123 | Exceptional 20.1% |
| Immigrants | Chile | 94.3 /100 | #124 | Exceptional 20.1% |
| Immigrants | South Africa | 93.9 /100 | #125 | Exceptional 20.1% |
| Serbians | 93.3 /100 | #126 | Exceptional 20.1% |
| Mongolians | 93.2 /100 | #127 | Exceptional 20.2% |
| Immigrants | Spain | 92.7 /100 | #128 | Exceptional 20.2% |
| Immigrants | Morocco | 92.4 /100 | #129 | Exceptional 20.2% |
| Immigrants | Hungary | 92.3 /100 | #130 | Exceptional 20.2% |