Russian vs Brazilian Single Female Poverty
COMPARE
Russian
Brazilian
Single Female Poverty
Single Female Poverty Comparison
Russians
Brazilians
19.2%
SINGLE FEMALE POVERTY
99.6/ 100
METRIC RATING
60th/ 347
METRIC RANK
20.1%
SINGLE FEMALE POVERTY
94.4/ 100
METRIC RATING
123rd/ 347
METRIC RANK
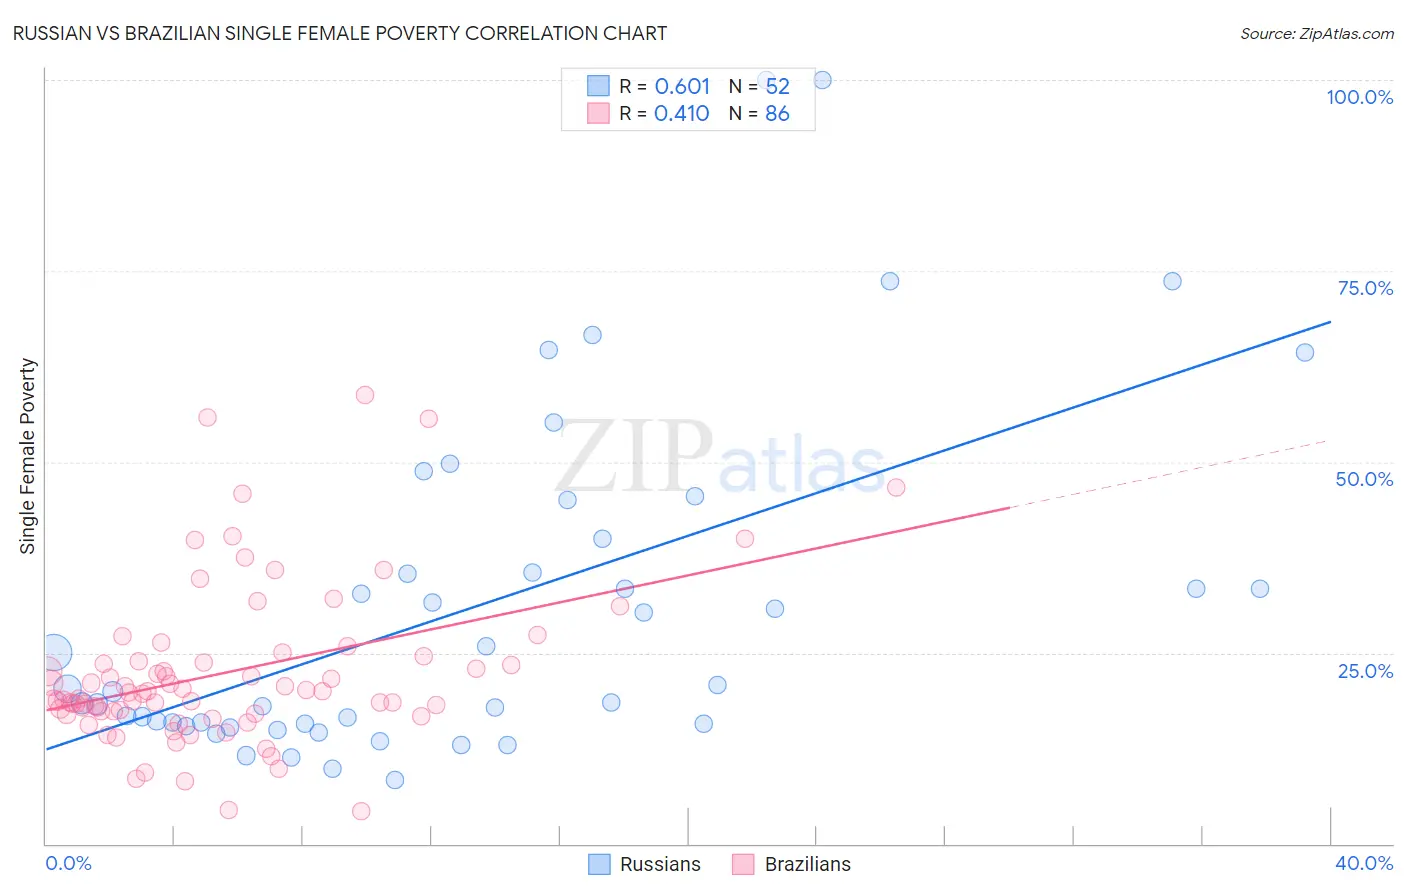
Russian vs Brazilian Single Female Poverty Correlation Chart
The statistical analysis conducted on geographies consisting of 497,545,833 people shows a significant positive correlation between the proportion of Russians and poverty level among single females in the United States with a correlation coefficient (R) of 0.601 and weighted average of 19.2%. Similarly, the statistical analysis conducted on geographies consisting of 319,523,574 people shows a moderate positive correlation between the proportion of Brazilians and poverty level among single females in the United States with a correlation coefficient (R) of 0.410 and weighted average of 20.1%, a difference of 4.7%.
Single Female Poverty Correlation Summary
| Measurement | Russian | Brazilian |
| Minimum | 8.3% | 4.3% |
| Maximum | 100.0% | 58.7% |
| Range | 91.7% | 54.4% |
| Mean | 31.0% | 22.4% |
| Median | 20.1% | 19.7% |
| Interquartile 25% (IQ1) | 15.7% | 17.3% |
| Interquartile 75% (IQ3) | 37.8% | 23.9% |
| Interquartile Range (IQR) | 22.1% | 6.6% |
| Standard Deviation (Sample) | 22.3% | 10.5% |
| Standard Deviation (Population) | 22.1% | 10.4% |
Similar Demographics by Single Female Poverty
Demographics Similar to Russians by Single Female Poverty
In terms of single female poverty, the demographic groups most similar to Russians are Cambodian (19.2%, a difference of 0.020%), Lithuanian (19.2%, a difference of 0.070%), Sri Lankan (19.2%, a difference of 0.10%), Immigrants from Northern Europe (19.2%, a difference of 0.19%), and Immigrants from Bulgaria (19.1%, a difference of 0.20%).
| Demographics | Rating | Rank | Single Female Poverty |
| Tsimshian | 99.7 /100 | #53 | Exceptional 19.1% |
| Argentineans | 99.7 /100 | #54 | Exceptional 19.1% |
| Immigrants | Vietnam | 99.7 /100 | #55 | Exceptional 19.1% |
| Immigrants | Fiji | 99.7 /100 | #56 | Exceptional 19.1% |
| Eastern Europeans | 99.7 /100 | #57 | Exceptional 19.1% |
| Immigrants | Bulgaria | 99.7 /100 | #58 | Exceptional 19.1% |
| Sri Lankans | 99.6 /100 | #59 | Exceptional 19.2% |
| Russians | 99.6 /100 | #60 | Exceptional 19.2% |
| Cambodians | 99.6 /100 | #61 | Exceptional 19.2% |
| Lithuanians | 99.6 /100 | #62 | Exceptional 19.2% |
| Immigrants | Northern Europe | 99.6 /100 | #63 | Exceptional 19.2% |
| Immigrants | Europe | 99.6 /100 | #64 | Exceptional 19.2% |
| Cypriots | 99.6 /100 | #65 | Exceptional 19.2% |
| Palestinians | 99.6 /100 | #66 | Exceptional 19.2% |
| Immigrants | Egypt | 99.6 /100 | #67 | Exceptional 19.2% |
Demographics Similar to Brazilians by Single Female Poverty
In terms of single female poverty, the demographic groups most similar to Brazilians are Immigrants from Chile (20.1%, a difference of 0.030%), Immigrants from South Africa (20.1%, a difference of 0.15%), Immigrants from South America (20.0%, a difference of 0.18%), Immigrants from Switzerland (20.0%, a difference of 0.21%), and South American (20.0%, a difference of 0.24%).
| Demographics | Rating | Rank | Single Female Poverty |
| Immigrants | Kazakhstan | 95.7 /100 | #116 | Exceptional 20.0% |
| Poles | 95.6 /100 | #117 | Exceptional 20.0% |
| Immigrants | Afghanistan | 95.4 /100 | #118 | Exceptional 20.0% |
| Immigrants | Ethiopia | 95.4 /100 | #119 | Exceptional 20.0% |
| South Americans | 95.1 /100 | #120 | Exceptional 20.0% |
| Immigrants | Switzerland | 95.1 /100 | #121 | Exceptional 20.0% |
| Immigrants | South America | 95.0 /100 | #122 | Exceptional 20.0% |
| Brazilians | 94.4 /100 | #123 | Exceptional 20.1% |
| Immigrants | Chile | 94.3 /100 | #124 | Exceptional 20.1% |
| Immigrants | South Africa | 93.9 /100 | #125 | Exceptional 20.1% |
| Serbians | 93.3 /100 | #126 | Exceptional 20.1% |
| Mongolians | 93.2 /100 | #127 | Exceptional 20.2% |
| Immigrants | Spain | 92.7 /100 | #128 | Exceptional 20.2% |
| Immigrants | Morocco | 92.4 /100 | #129 | Exceptional 20.2% |
| Immigrants | Hungary | 92.3 /100 | #130 | Exceptional 20.2% |