Navajo vs White/Caucasian Unemployment Among Youth under 25 years
COMPARE
Navajo
White/Caucasian
Unemployment Among Youth under 25 years
Unemployment Among Youth under 25 years Comparison
Navajo
Whites/Caucasians
18.6%
UNEMPLOYMENT AMONG YOUTH UNDER 25 YEARS
0.0/ 100
METRIC RATING
343rd/ 347
METRIC RANK
11.2%
UNEMPLOYMENT AMONG YOUTH UNDER 25 YEARS
96.9/ 100
METRIC RATING
77th/ 347
METRIC RANK
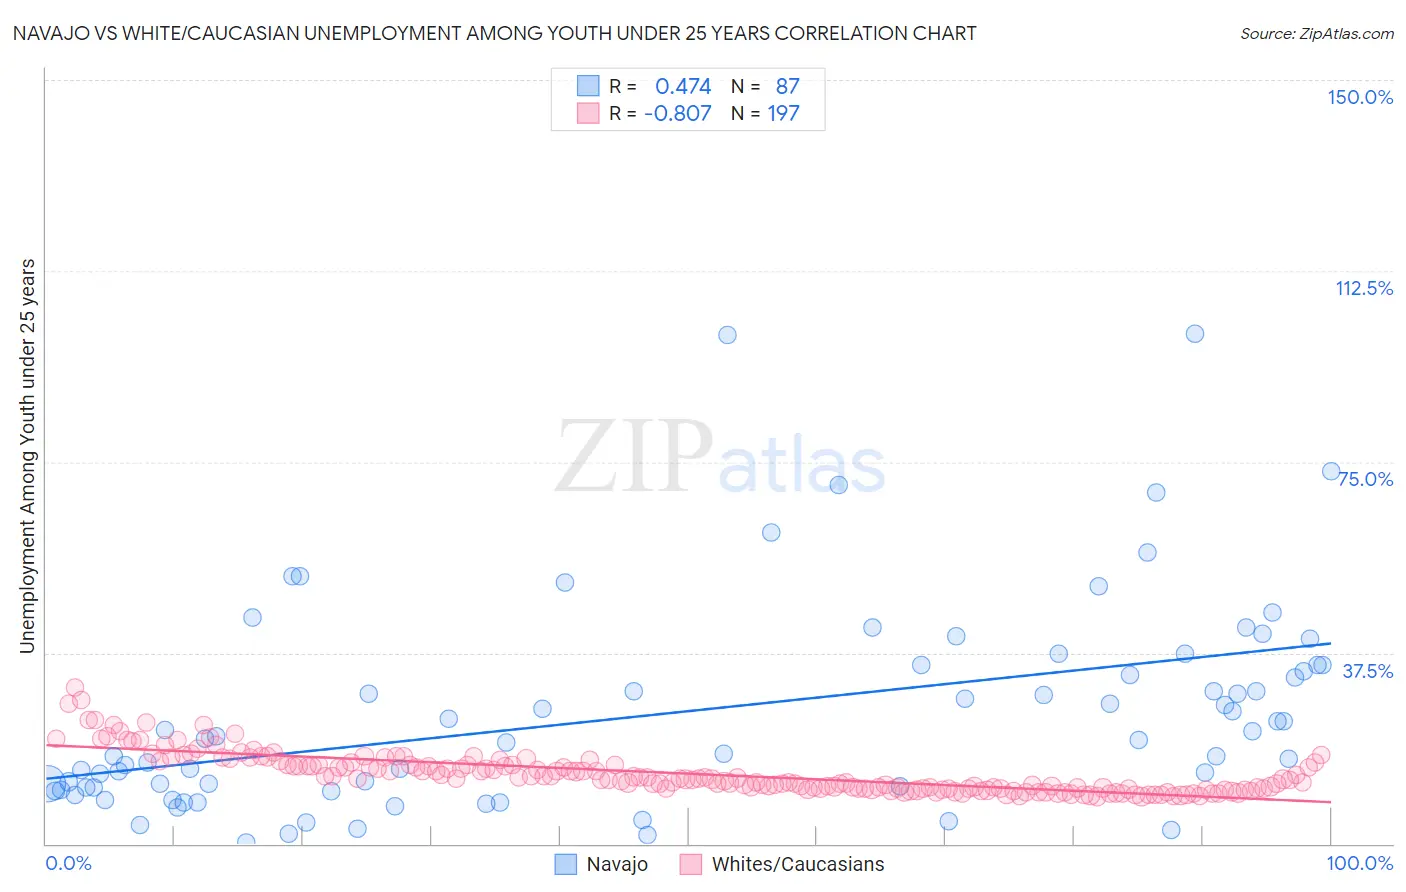
Navajo vs White/Caucasian Unemployment Among Youth under 25 years Correlation Chart
The statistical analysis conducted on geographies consisting of 223,013,083 people shows a moderate positive correlation between the proportion of Navajo and unemployment rate among youth under the age of 25 in the United States with a correlation coefficient (R) of 0.474 and weighted average of 18.6%. Similarly, the statistical analysis conducted on geographies consisting of 555,079,229 people shows a very strong negative correlation between the proportion of Whites/Caucasians and unemployment rate among youth under the age of 25 in the United States with a correlation coefficient (R) of -0.807 and weighted average of 11.2%, a difference of 66.3%.
Unemployment Among Youth under 25 years Correlation Summary
| Measurement | Navajo | White/Caucasian |
| Minimum | 0.30% | 9.2% |
| Maximum | 100.1% | 30.8% |
| Range | 99.8% | 21.5% |
| Mean | 25.7% | 13.7% |
| Median | 20.7% | 12.7% |
| Interquartile 25% (IQ1) | 11.1% | 10.8% |
| Interquartile 75% (IQ3) | 35.1% | 15.5% |
| Interquartile Range (IQR) | 24.0% | 4.7% |
| Standard Deviation (Sample) | 20.5% | 4.0% |
| Standard Deviation (Population) | 20.4% | 3.9% |
Similar Demographics by Unemployment Among Youth under 25 years
Demographics Similar to Navajo by Unemployment Among Youth under 25 years
In terms of unemployment among youth under 25 years, the demographic groups most similar to Navajo are Puerto Rican (18.4%, a difference of 1.2%), Paiute (17.6%, a difference of 6.0%), Crow (20.1%, a difference of 7.8%), Colville (16.8%, a difference of 11.1%), and Tsimshian (16.5%, a difference of 13.0%).
| Demographics | Rating | Rank | Unemployment Among Youth under 25 years |
| Guyanese | 0.0 /100 | #333 | Tragic 15.9% |
| Immigrants | Guyana | 0.0 /100 | #334 | Tragic 15.9% |
| Immigrants | St. Vincent and the Grenadines | 0.0 /100 | #335 | Tragic 16.1% |
| Pima | 0.0 /100 | #336 | Tragic 16.2% |
| Arapaho | 0.0 /100 | #337 | Tragic 16.3% |
| Yuman | 0.0 /100 | #338 | Tragic 16.3% |
| Tsimshian | 0.0 /100 | #339 | Tragic 16.5% |
| Colville | 0.0 /100 | #340 | Tragic 16.8% |
| Paiute | 0.0 /100 | #341 | Tragic 17.6% |
| Puerto Ricans | 0.0 /100 | #342 | Tragic 18.4% |
| Navajo | 0.0 /100 | #343 | Tragic 18.6% |
| Crow | 0.0 /100 | #344 | Tragic 20.1% |
| Hopi | 0.0 /100 | #345 | Tragic 21.5% |
| Inupiat | 0.0 /100 | #346 | Tragic 22.0% |
| Yup'ik | 0.0 /100 | #347 | Tragic 23.7% |
Demographics Similar to Whites/Caucasians by Unemployment Among Youth under 25 years
In terms of unemployment among youth under 25 years, the demographic groups most similar to Whites/Caucasians are German Russian (11.2%, a difference of 0.050%), Immigrants from Nicaragua (11.2%, a difference of 0.060%), Immigrants from Canada (11.2%, a difference of 0.070%), French (11.2%, a difference of 0.080%), and New Zealander (11.2%, a difference of 0.11%).
| Demographics | Rating | Rank | Unemployment Among Youth under 25 years |
| Slavs | 97.5 /100 | #70 | Exceptional 11.2% |
| Bhutanese | 97.4 /100 | #71 | Exceptional 11.2% |
| Immigrants | Australia | 97.3 /100 | #72 | Exceptional 11.2% |
| Creek | 97.2 /100 | #73 | Exceptional 11.2% |
| New Zealanders | 97.2 /100 | #74 | Exceptional 11.2% |
| French | 97.1 /100 | #75 | Exceptional 11.2% |
| German Russians | 97.0 /100 | #76 | Exceptional 11.2% |
| Whites/Caucasians | 96.9 /100 | #77 | Exceptional 11.2% |
| Immigrants | Nicaragua | 96.7 /100 | #78 | Exceptional 11.2% |
| Immigrants | Canada | 96.7 /100 | #79 | Exceptional 11.2% |
| Immigrants | Bulgaria | 96.4 /100 | #80 | Exceptional 11.2% |
| Icelanders | 96.3 /100 | #81 | Exceptional 11.2% |
| Northern Europeans | 96.2 /100 | #82 | Exceptional 11.2% |
| Bolivians | 96.1 /100 | #83 | Exceptional 11.2% |
| French Canadians | 95.9 /100 | #84 | Exceptional 11.2% |