Spanish American Indian vs White/Caucasian Single Mother Poverty
COMPARE
Spanish American Indian
White/Caucasian
Single Mother Poverty
Single Mother Poverty Comparison
Spanish American Indians
Whites/Caucasians
29.6%
SINGLE MOTHER POVERTY
23.4/ 100
METRIC RATING
196th/ 347
METRIC RANK
31.2%
SINGLE MOTHER POVERTY
0.3/ 100
METRIC RATING
260th/ 347
METRIC RANK
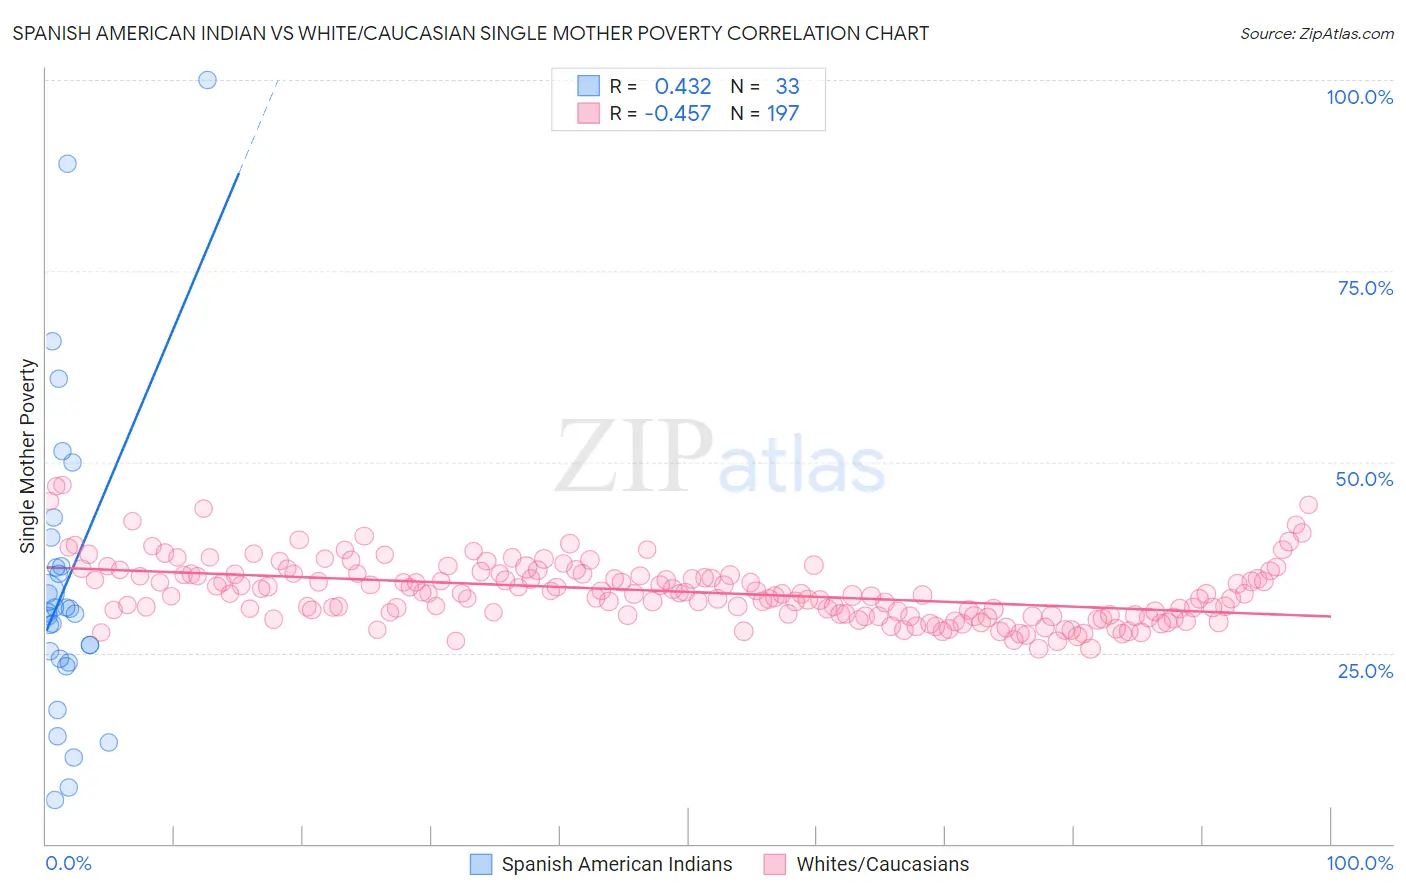
Spanish American Indian vs White/Caucasian Single Mother Poverty Correlation Chart
The statistical analysis conducted on geographies consisting of 73,007,770 people shows a moderate positive correlation between the proportion of Spanish American Indians and poverty level among single mothers in the United States with a correlation coefficient (R) of 0.432 and weighted average of 29.6%. Similarly, the statistical analysis conducted on geographies consisting of 551,530,681 people shows a moderate negative correlation between the proportion of Whites/Caucasians and poverty level among single mothers in the United States with a correlation coefficient (R) of -0.457 and weighted average of 31.2%, a difference of 5.4%.
Single Mother Poverty Correlation Summary
| Measurement | Spanish American Indian | White/Caucasian |
| Minimum | 5.7% | 25.5% |
| Maximum | 100.0% | 47.0% |
| Range | 94.3% | 21.5% |
| Mean | 34.3% | 33.0% |
| Median | 30.3% | 32.7% |
| Interquartile 25% (IQ1) | 24.0% | 29.9% |
| Interquartile 75% (IQ3) | 38.2% | 35.3% |
| Interquartile Range (IQR) | 14.2% | 5.4% |
| Standard Deviation (Sample) | 20.6% | 4.0% |
| Standard Deviation (Population) | 20.3% | 4.0% |
Similar Demographics by Single Mother Poverty
Demographics Similar to Spanish American Indians by Single Mother Poverty
In terms of single mother poverty, the demographic groups most similar to Spanish American Indians are Slavic (29.6%, a difference of 0.070%), Immigrants from Jamaica (29.6%, a difference of 0.10%), Trinidadian and Tobagonian (29.6%, a difference of 0.11%), Icelander (29.5%, a difference of 0.17%), and Cuban (29.6%, a difference of 0.18%).
| Demographics | Rating | Rank | Single Mother Poverty |
| Immigrants | Africa | 31.6 /100 | #189 | Fair 29.4% |
| Immigrants | Germany | 30.4 /100 | #190 | Fair 29.5% |
| Immigrants | Trinidad and Tobago | 29.2 /100 | #191 | Fair 29.5% |
| Moroccans | 28.6 /100 | #192 | Fair 29.5% |
| Basques | 28.3 /100 | #193 | Fair 29.5% |
| Icelanders | 26.1 /100 | #194 | Fair 29.5% |
| Slavs | 24.5 /100 | #195 | Fair 29.6% |
| Spanish American Indians | 23.4 /100 | #196 | Fair 29.6% |
| Immigrants | Jamaica | 22.0 /100 | #197 | Fair 29.6% |
| Trinidadians and Tobagonians | 21.7 /100 | #198 | Fair 29.6% |
| Cubans | 20.8 /100 | #199 | Fair 29.6% |
| Panamanians | 20.0 /100 | #200 | Fair 29.6% |
| Belgians | 18.8 /100 | #201 | Poor 29.7% |
| Malaysians | 17.4 /100 | #202 | Poor 29.7% |
| Swiss | 17.2 /100 | #203 | Poor 29.7% |
Demographics Similar to Whites/Caucasians by Single Mother Poverty
In terms of single mother poverty, the demographic groups most similar to Whites/Caucasians are Immigrants from El Salvador (31.2%, a difference of 0.080%), Immigrants from Bangladesh (31.1%, a difference of 0.16%), Immigrants from Caribbean (31.1%, a difference of 0.19%), Hmong (31.2%, a difference of 0.21%), and Immigrants from Bahamas (31.1%, a difference of 0.28%).
| Demographics | Rating | Rank | Single Mother Poverty |
| Celtics | 0.6 /100 | #253 | Tragic 30.9% |
| Senegalese | 0.5 /100 | #254 | Tragic 31.0% |
| Belizeans | 0.5 /100 | #255 | Tragic 31.0% |
| Immigrants | West Indies | 0.4 /100 | #256 | Tragic 31.1% |
| Immigrants | Bahamas | 0.4 /100 | #257 | Tragic 31.1% |
| Immigrants | Caribbean | 0.4 /100 | #258 | Tragic 31.1% |
| Immigrants | Bangladesh | 0.4 /100 | #259 | Tragic 31.1% |
| Whites/Caucasians | 0.3 /100 | #260 | Tragic 31.2% |
| Immigrants | El Salvador | 0.3 /100 | #261 | Tragic 31.2% |
| Hmong | 0.3 /100 | #262 | Tragic 31.2% |
| Bahamians | 0.2 /100 | #263 | Tragic 31.3% |
| Immigrants | Ecuador | 0.2 /100 | #264 | Tragic 31.3% |
| German Russians | 0.2 /100 | #265 | Tragic 31.3% |
| Sub-Saharan Africans | 0.2 /100 | #266 | Tragic 31.4% |
| Immigrants | Belize | 0.2 /100 | #267 | Tragic 31.4% |