Spanish vs Kiowa Single Mother Poverty
COMPARE
Spanish
Kiowa
Single Mother Poverty
Single Mother Poverty Comparison
Spanish
Kiowa
30.1%
SINGLE MOTHER POVERTY
6.3/ 100
METRIC RATING
225th/ 347
METRIC RANK
35.5%
SINGLE MOTHER POVERTY
0.0/ 100
METRIC RATING
323rd/ 347
METRIC RANK
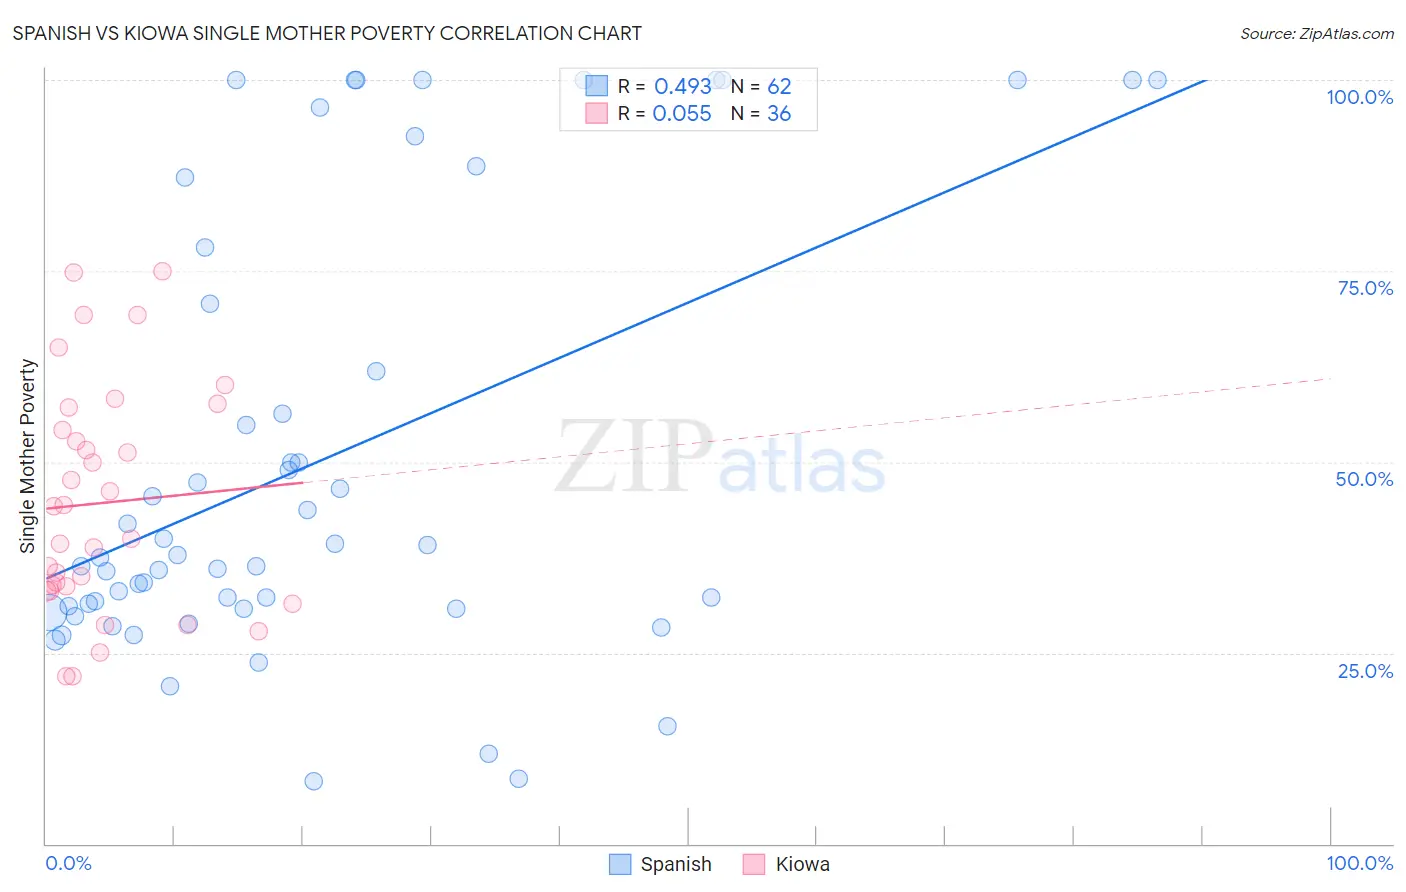
Spanish vs Kiowa Single Mother Poverty Correlation Chart
The statistical analysis conducted on geographies consisting of 411,729,340 people shows a moderate positive correlation between the proportion of Spanish and poverty level among single mothers in the United States with a correlation coefficient (R) of 0.493 and weighted average of 30.1%. Similarly, the statistical analysis conducted on geographies consisting of 55,943,976 people shows a slight positive correlation between the proportion of Kiowa and poverty level among single mothers in the United States with a correlation coefficient (R) of 0.055 and weighted average of 35.5%, a difference of 17.8%.
Single Mother Poverty Correlation Summary
| Measurement | Spanish | Kiowa |
| Minimum | 8.1% | 21.9% |
| Maximum | 100.0% | 75.0% |
| Range | 91.9% | 53.1% |
| Mean | 50.1% | 44.6% |
| Median | 37.7% | 42.1% |
| Interquartile 25% (IQ1) | 30.8% | 33.5% |
| Interquartile 75% (IQ3) | 70.7% | 55.7% |
| Interquartile Range (IQR) | 39.9% | 22.2% |
| Standard Deviation (Sample) | 28.6% | 15.0% |
| Standard Deviation (Population) | 28.4% | 14.7% |
Similar Demographics by Single Mother Poverty
Demographics Similar to Spanish by Single Mother Poverty
In terms of single mother poverty, the demographic groups most similar to Spanish are Immigrants from Sudan (30.1%, a difference of 0.030%), Scottish (30.1%, a difference of 0.060%), Immigrants from Liberia (30.1%, a difference of 0.090%), Immigrants from Cuba (30.1%, a difference of 0.10%), and Spaniard (30.2%, a difference of 0.20%).
| Demographics | Rating | Rank | Single Mother Poverty |
| Hungarians | 10.3 /100 | #218 | Poor 29.9% |
| Finns | 9.3 /100 | #219 | Tragic 30.0% |
| Germans | 8.8 /100 | #220 | Tragic 30.0% |
| Immigrants | Eritrea | 7.7 /100 | #221 | Tragic 30.0% |
| Sudanese | 7.6 /100 | #222 | Tragic 30.0% |
| Immigrants | Cuba | 6.9 /100 | #223 | Tragic 30.1% |
| Immigrants | Sudan | 6.5 /100 | #224 | Tragic 30.1% |
| Spanish | 6.3 /100 | #225 | Tragic 30.1% |
| Scottish | 6.0 /100 | #226 | Tragic 30.1% |
| Immigrants | Liberia | 5.9 /100 | #227 | Tragic 30.1% |
| Spaniards | 5.4 /100 | #228 | Tragic 30.2% |
| Immigrants | Barbados | 5.0 /100 | #229 | Tragic 30.2% |
| English | 4.8 /100 | #230 | Tragic 30.2% |
| Dutch | 4.3 /100 | #231 | Tragic 30.2% |
| Alaskan Athabascans | 4.1 /100 | #232 | Tragic 30.3% |
Demographics Similar to Kiowa by Single Mother Poverty
In terms of single mother poverty, the demographic groups most similar to Kiowa are Ottawa (35.5%, a difference of 0.21%), Ute (35.7%, a difference of 0.69%), Black/African American (35.2%, a difference of 0.71%), Paiute (35.1%, a difference of 0.91%), and Seminole (35.8%, a difference of 0.99%).
| Demographics | Rating | Rank | Single Mother Poverty |
| Dominicans | 0.0 /100 | #316 | Tragic 34.5% |
| Cherokee | 0.0 /100 | #317 | Tragic 34.5% |
| Immigrants | Honduras | 0.0 /100 | #318 | Tragic 34.7% |
| Chippewa | 0.0 /100 | #319 | Tragic 34.8% |
| Iroquois | 0.0 /100 | #320 | Tragic 34.8% |
| Paiute | 0.0 /100 | #321 | Tragic 35.1% |
| Blacks/African Americans | 0.0 /100 | #322 | Tragic 35.2% |
| Kiowa | 0.0 /100 | #323 | Tragic 35.5% |
| Ottawa | 0.0 /100 | #324 | Tragic 35.5% |
| Ute | 0.0 /100 | #325 | Tragic 35.7% |
| Seminole | 0.0 /100 | #326 | Tragic 35.8% |
| Yakama | 0.0 /100 | #327 | Tragic 36.4% |
| Choctaw | 0.0 /100 | #328 | Tragic 36.4% |
| Apache | 0.0 /100 | #329 | Tragic 36.6% |
| Natives/Alaskans | 0.0 /100 | #330 | Tragic 36.6% |