Chilean vs Kiowa Single Mother Poverty
COMPARE
Chilean
Kiowa
Single Mother Poverty
Single Mother Poverty Comparison
Chileans
Kiowa
27.9%
SINGLE MOTHER POVERTY
97.5/ 100
METRIC RATING
95th/ 347
METRIC RANK
35.5%
SINGLE MOTHER POVERTY
0.0/ 100
METRIC RATING
323rd/ 347
METRIC RANK
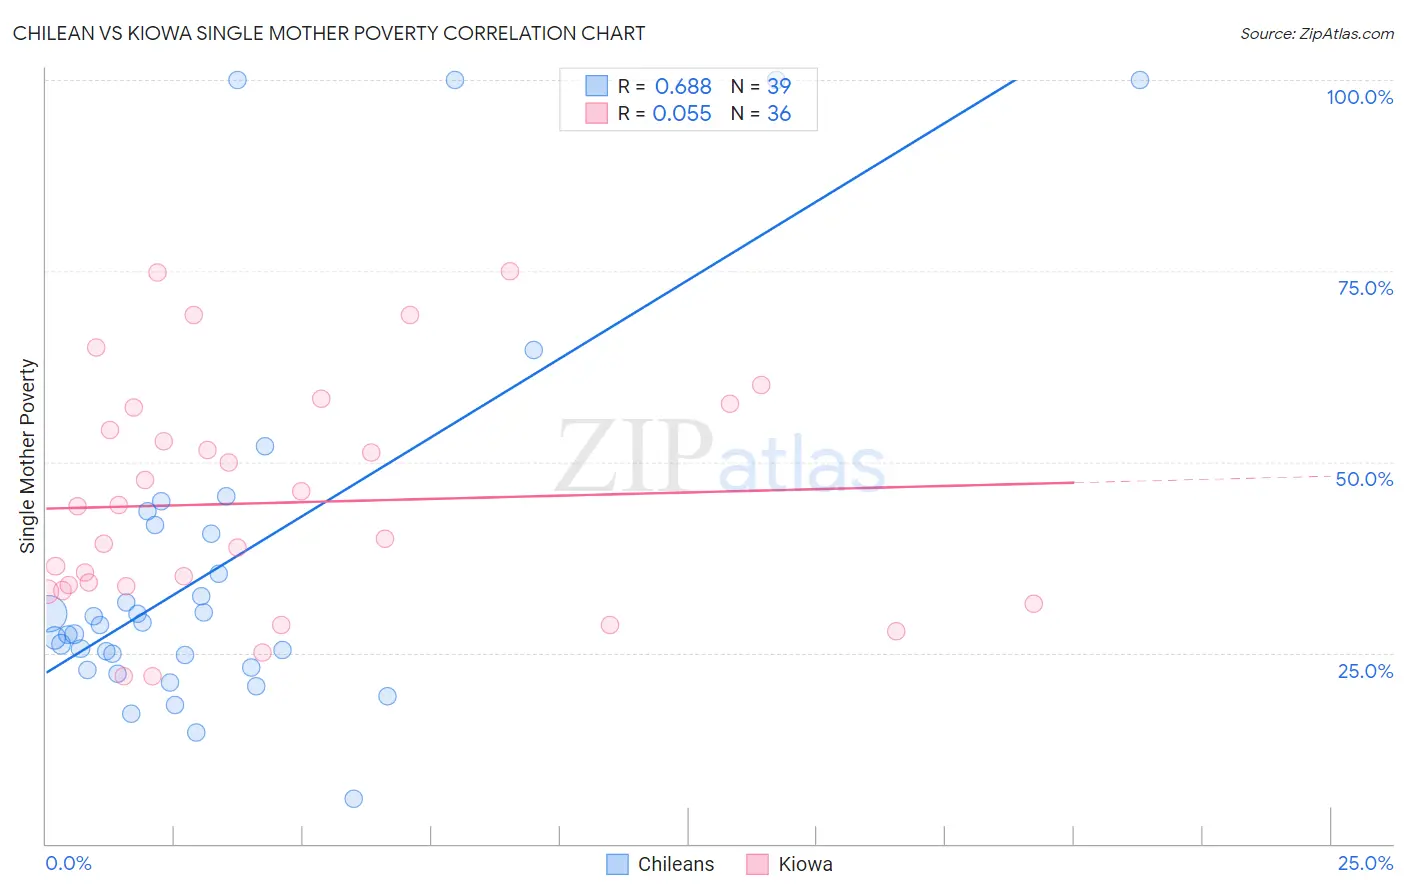
Chilean vs Kiowa Single Mother Poverty Correlation Chart
The statistical analysis conducted on geographies consisting of 252,857,793 people shows a significant positive correlation between the proportion of Chileans and poverty level among single mothers in the United States with a correlation coefficient (R) of 0.688 and weighted average of 27.9%. Similarly, the statistical analysis conducted on geographies consisting of 55,943,976 people shows a slight positive correlation between the proportion of Kiowa and poverty level among single mothers in the United States with a correlation coefficient (R) of 0.055 and weighted average of 35.5%, a difference of 27.2%.
Single Mother Poverty Correlation Summary
| Measurement | Chilean | Kiowa |
| Minimum | 5.9% | 21.9% |
| Maximum | 100.0% | 75.0% |
| Range | 94.1% | 53.1% |
| Mean | 36.6% | 44.6% |
| Median | 28.7% | 42.1% |
| Interquartile 25% (IQ1) | 23.1% | 33.5% |
| Interquartile 75% (IQ3) | 41.7% | 55.7% |
| Interquartile Range (IQR) | 18.5% | 22.2% |
| Standard Deviation (Sample) | 24.2% | 15.0% |
| Standard Deviation (Population) | 23.9% | 14.7% |
Similar Demographics by Single Mother Poverty
Demographics Similar to Chileans by Single Mother Poverty
In terms of single mother poverty, the demographic groups most similar to Chileans are Albanian (27.9%, a difference of 0.030%), Immigrants from Iraq (27.9%, a difference of 0.10%), Romanian (27.8%, a difference of 0.13%), Immigrants from Brazil (27.9%, a difference of 0.14%), and Immigrants from Nepal (27.9%, a difference of 0.15%).
| Demographics | Rating | Rank | Single Mother Poverty |
| Ethiopians | 98.4 /100 | #88 | Exceptional 27.7% |
| Immigrants | Ethiopia | 98.4 /100 | #89 | Exceptional 27.7% |
| Immigrants | France | 98.2 /100 | #90 | Exceptional 27.8% |
| Immigrants | Albania | 98.0 /100 | #91 | Exceptional 27.8% |
| Estonians | 97.9 /100 | #92 | Exceptional 27.8% |
| Romanians | 97.8 /100 | #93 | Exceptional 27.8% |
| Albanians | 97.6 /100 | #94 | Exceptional 27.9% |
| Chileans | 97.5 /100 | #95 | Exceptional 27.9% |
| Immigrants | Iraq | 97.3 /100 | #96 | Exceptional 27.9% |
| Immigrants | Brazil | 97.2 /100 | #97 | Exceptional 27.9% |
| Immigrants | Nepal | 97.2 /100 | #98 | Exceptional 27.9% |
| Immigrants | Netherlands | 97.2 /100 | #99 | Exceptional 27.9% |
| Zimbabweans | 97.1 /100 | #100 | Exceptional 27.9% |
| Pakistanis | 96.9 /100 | #101 | Exceptional 28.0% |
| Immigrants | Croatia | 96.7 /100 | #102 | Exceptional 28.0% |
Demographics Similar to Kiowa by Single Mother Poverty
In terms of single mother poverty, the demographic groups most similar to Kiowa are Ottawa (35.5%, a difference of 0.21%), Ute (35.7%, a difference of 0.69%), Black/African American (35.2%, a difference of 0.71%), Paiute (35.1%, a difference of 0.91%), and Seminole (35.8%, a difference of 0.99%).
| Demographics | Rating | Rank | Single Mother Poverty |
| Dominicans | 0.0 /100 | #316 | Tragic 34.5% |
| Cherokee | 0.0 /100 | #317 | Tragic 34.5% |
| Immigrants | Honduras | 0.0 /100 | #318 | Tragic 34.7% |
| Chippewa | 0.0 /100 | #319 | Tragic 34.8% |
| Iroquois | 0.0 /100 | #320 | Tragic 34.8% |
| Paiute | 0.0 /100 | #321 | Tragic 35.1% |
| Blacks/African Americans | 0.0 /100 | #322 | Tragic 35.2% |
| Kiowa | 0.0 /100 | #323 | Tragic 35.5% |
| Ottawa | 0.0 /100 | #324 | Tragic 35.5% |
| Ute | 0.0 /100 | #325 | Tragic 35.7% |
| Seminole | 0.0 /100 | #326 | Tragic 35.8% |
| Yakama | 0.0 /100 | #327 | Tragic 36.4% |
| Choctaw | 0.0 /100 | #328 | Tragic 36.4% |
| Apache | 0.0 /100 | #329 | Tragic 36.6% |
| Natives/Alaskans | 0.0 /100 | #330 | Tragic 36.6% |