Colville vs Kiowa Single Mother Poverty
COMPARE
Colville
Kiowa
Single Mother Poverty
Single Mother Poverty Comparison
Colville
Kiowa
39.3%
SINGLE MOTHER POVERTY
0.0/ 100
METRIC RATING
341st/ 347
METRIC RANK
35.5%
SINGLE MOTHER POVERTY
0.0/ 100
METRIC RATING
323rd/ 347
METRIC RANK
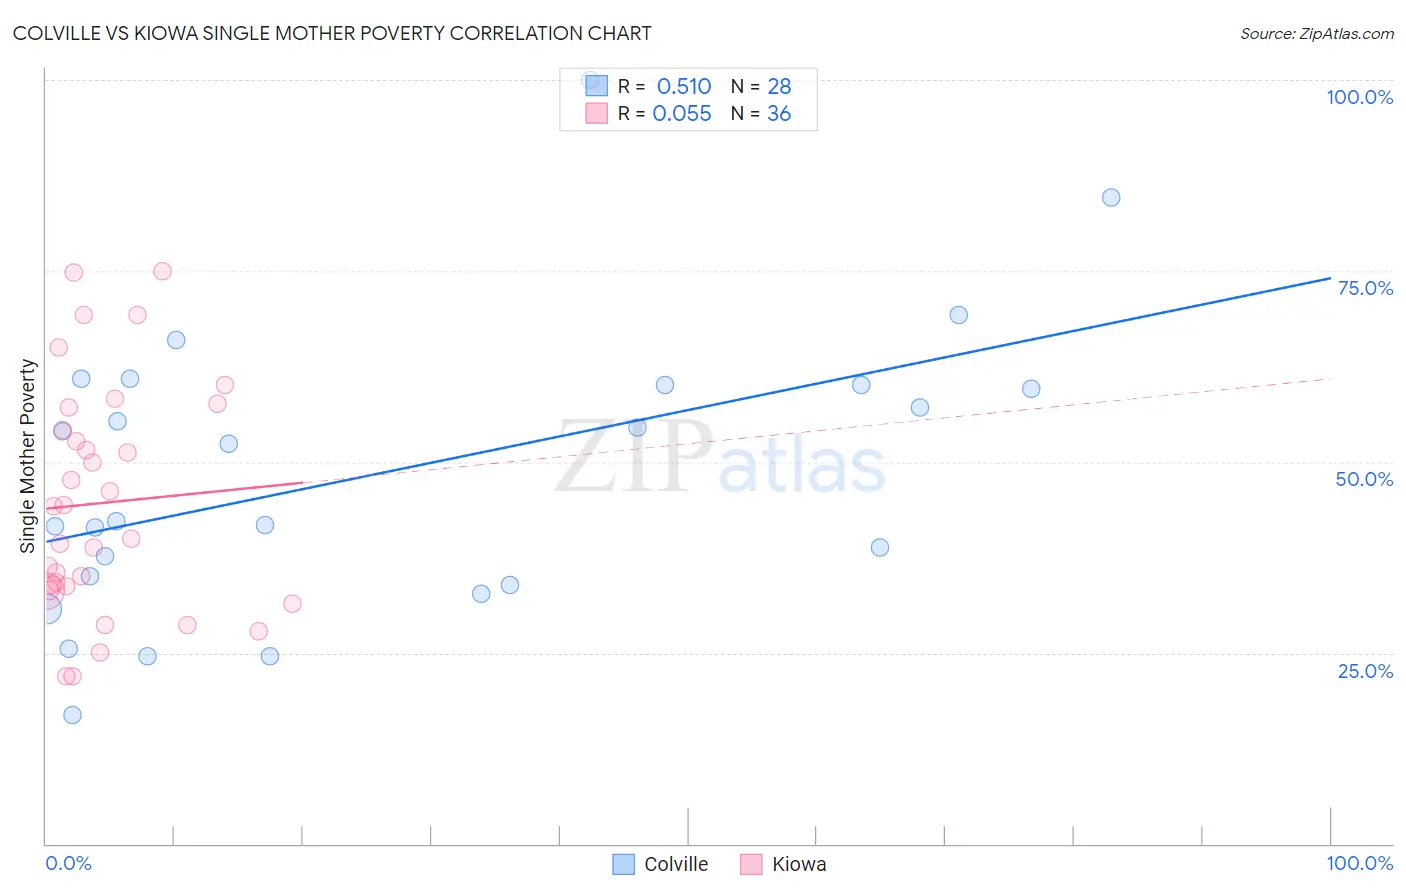
Colville vs Kiowa Single Mother Poverty Correlation Chart
The statistical analysis conducted on geographies consisting of 34,541,022 people shows a substantial positive correlation between the proportion of Colville and poverty level among single mothers in the United States with a correlation coefficient (R) of 0.510 and weighted average of 39.3%. Similarly, the statistical analysis conducted on geographies consisting of 55,943,976 people shows a slight positive correlation between the proportion of Kiowa and poverty level among single mothers in the United States with a correlation coefficient (R) of 0.055 and weighted average of 35.5%, a difference of 10.8%.
Single Mother Poverty Correlation Summary
| Measurement | Colville | Kiowa |
| Minimum | 16.8% | 21.9% |
| Maximum | 100.0% | 75.0% |
| Range | 83.2% | 53.1% |
| Mean | 48.6% | 44.6% |
| Median | 47.3% | 42.1% |
| Interquartile 25% (IQ1) | 34.5% | 33.5% |
| Interquartile 75% (IQ3) | 60.0% | 55.7% |
| Interquartile Range (IQR) | 25.5% | 22.2% |
| Standard Deviation (Sample) | 18.9% | 15.0% |
| Standard Deviation (Population) | 18.5% | 14.7% |
Demographics Similar to Colville and Kiowa by Single Mother Poverty
In terms of single mother poverty, the demographic groups most similar to Colville are Sioux (38.8%, a difference of 1.3%), Crow (38.6%, a difference of 1.7%), Pima (38.6%, a difference of 1.8%), Immigrants from Yemen (38.5%, a difference of 2.0%), and Cheyenne (38.5%, a difference of 2.1%). Similarly, the demographic groups most similar to Kiowa are Ottawa (35.5%, a difference of 0.21%), Ute (35.7%, a difference of 0.69%), Black/African American (35.2%, a difference of 0.71%), Seminole (35.8%, a difference of 0.99%), and Yakama (36.4%, a difference of 2.6%).
| Demographics | Rating | Rank | Single Mother Poverty |
| Blacks/African Americans | 0.0 /100 | #322 | Tragic 35.2% |
| Kiowa | 0.0 /100 | #323 | Tragic 35.5% |
| Ottawa | 0.0 /100 | #324 | Tragic 35.5% |
| Ute | 0.0 /100 | #325 | Tragic 35.7% |
| Seminole | 0.0 /100 | #326 | Tragic 35.8% |
| Yakama | 0.0 /100 | #327 | Tragic 36.4% |
| Choctaw | 0.0 /100 | #328 | Tragic 36.4% |
| Apache | 0.0 /100 | #329 | Tragic 36.6% |
| Natives/Alaskans | 0.0 /100 | #330 | Tragic 36.6% |
| Creek | 0.0 /100 | #331 | Tragic 36.7% |
| Dutch West Indians | 0.0 /100 | #332 | Tragic 36.8% |
| Menominee | 0.0 /100 | #333 | Tragic 37.1% |
| Pueblo | 0.0 /100 | #334 | Tragic 37.2% |
| Yuman | 0.0 /100 | #335 | Tragic 37.8% |
| Cheyenne | 0.0 /100 | #336 | Tragic 38.5% |
| Immigrants | Yemen | 0.0 /100 | #337 | Tragic 38.5% |
| Pima | 0.0 /100 | #338 | Tragic 38.6% |
| Crow | 0.0 /100 | #339 | Tragic 38.6% |
| Sioux | 0.0 /100 | #340 | Tragic 38.8% |
| Colville | 0.0 /100 | #341 | Tragic 39.3% |
| Navajo | 0.0 /100 | #342 | Tragic 40.2% |