Navajo vs Afghan Master's Degree
COMPARE
Navajo
Afghan
Master's Degree
Master's Degree Comparison
Navajo
Afghans
9.4%
MASTER'S DEGREE
0.0/ 100
METRIC RATING
341st/ 347
METRIC RANK
16.5%
MASTER'S DEGREE
96.2/ 100
METRIC RATING
121st/ 347
METRIC RANK
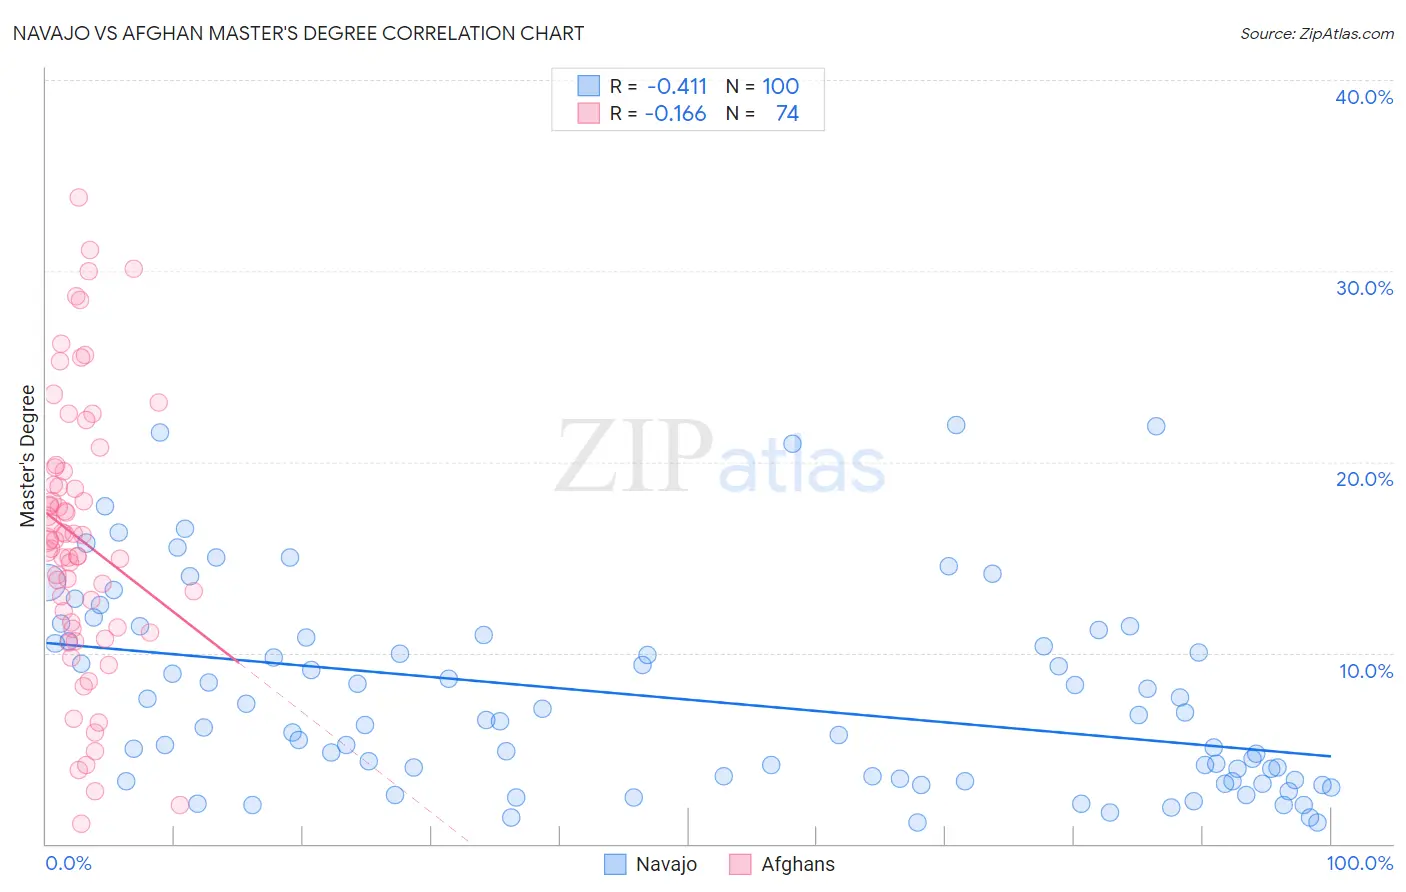
Navajo vs Afghan Master's Degree Correlation Chart
The statistical analysis conducted on geographies consisting of 224,762,496 people shows a moderate negative correlation between the proportion of Navajo and percentage of population with at least master's degree education in the United States with a correlation coefficient (R) of -0.411 and weighted average of 9.4%. Similarly, the statistical analysis conducted on geographies consisting of 148,857,027 people shows a poor negative correlation between the proportion of Afghans and percentage of population with at least master's degree education in the United States with a correlation coefficient (R) of -0.166 and weighted average of 16.5%, a difference of 74.6%.
Master's Degree Correlation Summary
| Measurement | Navajo | Afghan |
| Minimum | 1.1% | 1.0% |
| Maximum | 22.0% | 33.8% |
| Range | 20.9% | 32.8% |
| Mean | 7.6% | 16.0% |
| Median | 6.3% | 15.9% |
| Interquartile 25% (IQ1) | 3.3% | 11.3% |
| Interquartile 75% (IQ3) | 10.7% | 19.5% |
| Interquartile Range (IQR) | 7.4% | 8.2% |
| Standard Deviation (Sample) | 5.2% | 7.1% |
| Standard Deviation (Population) | 5.1% | 7.1% |
Similar Demographics by Master's Degree
Demographics Similar to Navajo by Master's Degree
In terms of master's degree, the demographic groups most similar to Navajo are Yakama (9.5%, a difference of 0.35%), Immigrants from Mexico (9.3%, a difference of 1.3%), Spanish American Indian (9.6%, a difference of 1.6%), Lumbee (9.3%, a difference of 1.8%), and Pima (9.2%, a difference of 1.9%).
| Demographics | Rating | Rank | Master's Degree |
| Menominee | 0.0 /100 | #333 | Tragic 10.2% |
| Arapaho | 0.0 /100 | #334 | Tragic 10.0% |
| Immigrants | Central America | 0.0 /100 | #335 | Tragic 10.0% |
| Natives/Alaskans | 0.0 /100 | #336 | Tragic 9.9% |
| Mexicans | 0.0 /100 | #337 | Tragic 9.7% |
| Tohono O'odham | 0.0 /100 | #338 | Tragic 9.7% |
| Spanish American Indians | 0.0 /100 | #339 | Tragic 9.6% |
| Yakama | 0.0 /100 | #340 | Tragic 9.5% |
| Navajo | 0.0 /100 | #341 | Tragic 9.4% |
| Immigrants | Mexico | 0.0 /100 | #342 | Tragic 9.3% |
| Lumbee | 0.0 /100 | #343 | Tragic 9.3% |
| Pima | 0.0 /100 | #344 | Tragic 9.2% |
| Yuman | 0.0 /100 | #345 | Tragic 9.2% |
| Yup'ik | 0.0 /100 | #346 | Tragic 8.5% |
| Houma | 0.0 /100 | #347 | Tragic 7.9% |
Demographics Similar to Afghans by Master's Degree
In terms of master's degree, the demographic groups most similar to Afghans are Lebanese (16.5%, a difference of 0.20%), Jordanian (16.5%, a difference of 0.30%), British (16.4%, a difference of 0.43%), Croatian (16.4%, a difference of 0.44%), and Immigrants from Eritrea (16.4%, a difference of 0.52%).
| Demographics | Rating | Rank | Master's Degree |
| Northern Europeans | 97.6 /100 | #114 | Exceptional 16.7% |
| Immigrants | Uganda | 97.3 /100 | #115 | Exceptional 16.6% |
| Immigrants | Southern Europe | 97.2 /100 | #116 | Exceptional 16.6% |
| Immigrants | Moldova | 97.2 /100 | #117 | Exceptional 16.6% |
| Brazilians | 96.8 /100 | #118 | Exceptional 16.5% |
| Jordanians | 96.5 /100 | #119 | Exceptional 16.5% |
| Lebanese | 96.4 /100 | #120 | Exceptional 16.5% |
| Afghans | 96.2 /100 | #121 | Exceptional 16.5% |
| British | 95.6 /100 | #122 | Exceptional 16.4% |
| Croatians | 95.6 /100 | #123 | Exceptional 16.4% |
| Immigrants | Eritrea | 95.5 /100 | #124 | Exceptional 16.4% |
| Italians | 95.4 /100 | #125 | Exceptional 16.4% |
| Immigrants | Eastern Africa | 95.2 /100 | #126 | Exceptional 16.3% |
| Palestinians | 94.8 /100 | #127 | Exceptional 16.3% |
| Immigrants | Sierra Leone | 94.7 /100 | #128 | Exceptional 16.3% |