Navajo vs Immigrants from Italy Poverty
COMPARE
Navajo
Immigrants from Italy
Poverty
Poverty Comparison
Navajo
Immigrants from Italy
23.1%
POVERTY
0.0/ 100
METRIC RATING
345th/ 347
METRIC RANK
11.2%
POVERTY
97.9/ 100
METRIC RATING
61st/ 347
METRIC RANK
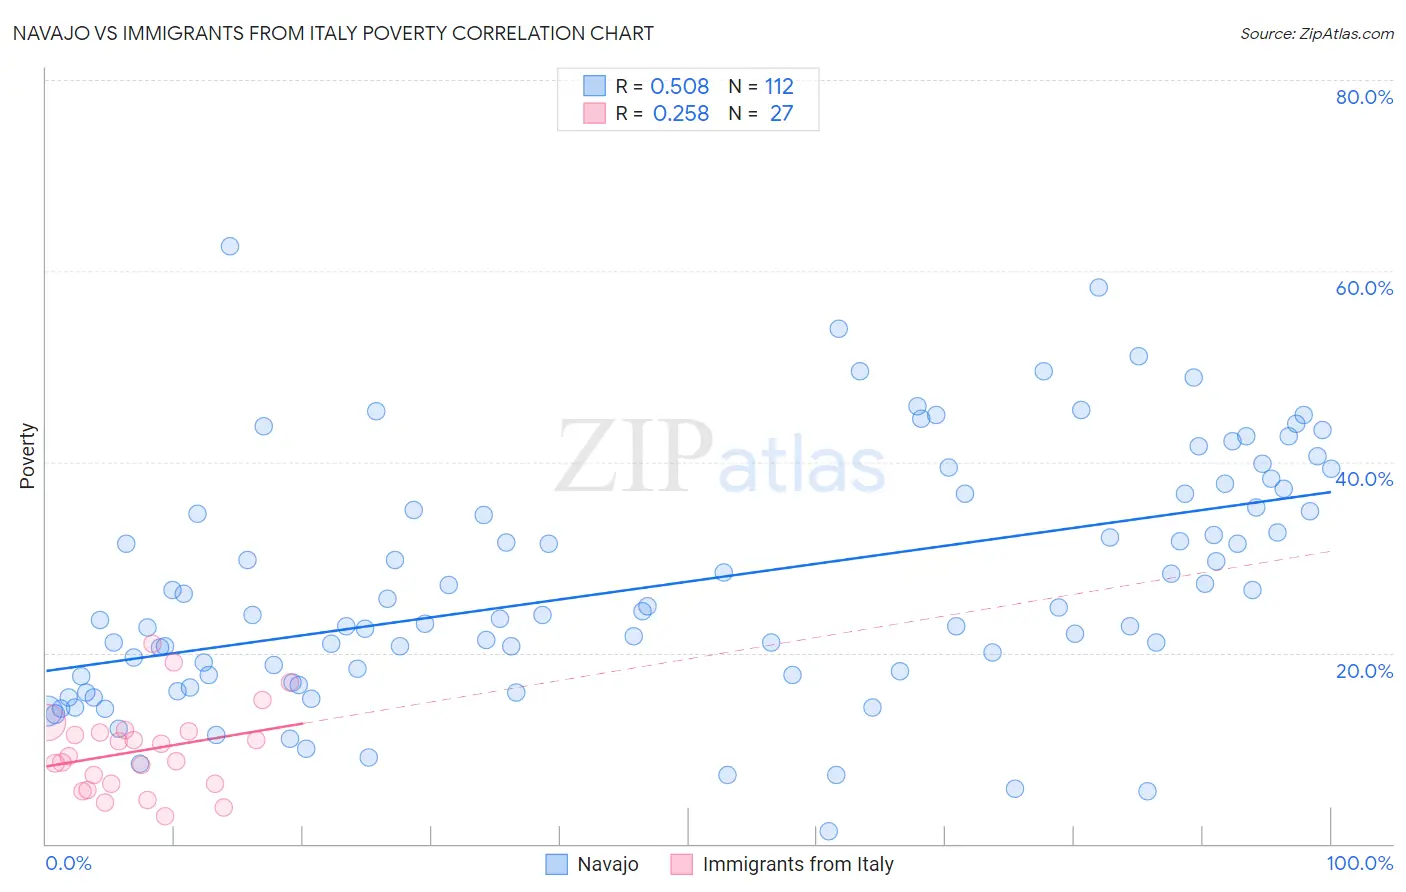
Navajo vs Immigrants from Italy Poverty Correlation Chart
The statistical analysis conducted on geographies consisting of 224,751,709 people shows a substantial positive correlation between the proportion of Navajo and poverty level in the United States with a correlation coefficient (R) of 0.508 and weighted average of 23.1%. Similarly, the statistical analysis conducted on geographies consisting of 324,121,527 people shows a weak positive correlation between the proportion of Immigrants from Italy and poverty level in the United States with a correlation coefficient (R) of 0.258 and weighted average of 11.2%, a difference of 106.5%.
Poverty Correlation Summary
| Measurement | Navajo | Immigrants from Italy |
| Minimum | 1.3% | 2.9% |
| Maximum | 62.6% | 21.0% |
| Range | 61.2% | 18.1% |
| Mean | 27.2% | 9.8% |
| Median | 24.2% | 9.2% |
| Interquartile 25% (IQ1) | 17.7% | 6.2% |
| Interquartile 75% (IQ3) | 36.7% | 11.8% |
| Interquartile Range (IQR) | 19.1% | 5.5% |
| Standard Deviation (Sample) | 12.7% | 4.5% |
| Standard Deviation (Population) | 12.6% | 4.4% |
Similar Demographics by Poverty
Demographics Similar to Navajo by Poverty
In terms of poverty, the demographic groups most similar to Navajo are Puerto Rican (23.7%, a difference of 2.5%), Lumbee (21.9%, a difference of 5.4%), Pima (21.9%, a difference of 5.6%), Tohono O'odham (24.4%, a difference of 5.7%), and Immigrants from Yemen (21.5%, a difference of 7.3%).
| Demographics | Rating | Rank | Poverty |
| Houma | 0.0 /100 | #333 | Tragic 18.4% |
| Apache | 0.0 /100 | #334 | Tragic 18.4% |
| Cheyenne | 0.0 /100 | #335 | Tragic 18.9% |
| Pueblo | 0.0 /100 | #336 | Tragic 19.4% |
| Sioux | 0.0 /100 | #337 | Tragic 19.8% |
| Yuman | 0.0 /100 | #338 | Tragic 20.2% |
| Crow | 0.0 /100 | #339 | Tragic 20.7% |
| Yup'ik | 0.0 /100 | #340 | Tragic 20.8% |
| Hopi | 0.0 /100 | #341 | Tragic 20.8% |
| Immigrants | Yemen | 0.0 /100 | #342 | Tragic 21.5% |
| Pima | 0.0 /100 | #343 | Tragic 21.9% |
| Lumbee | 0.0 /100 | #344 | Tragic 21.9% |
| Navajo | 0.0 /100 | #345 | Tragic 23.1% |
| Puerto Ricans | 0.0 /100 | #346 | Tragic 23.7% |
| Tohono O'odham | 0.0 /100 | #347 | Tragic 24.4% |
Demographics Similar to Immigrants from Italy by Poverty
In terms of poverty, the demographic groups most similar to Immigrants from Italy are Austrian (11.2%, a difference of 0.030%), Ukrainian (11.2%, a difference of 0.040%), Immigrants from Sri Lanka (11.2%, a difference of 0.060%), Immigrants from Europe (11.2%, a difference of 0.22%), and Swiss (11.2%, a difference of 0.25%).
| Demographics | Rating | Rank | Poverty |
| Immigrants | Bulgaria | 98.5 /100 | #54 | Exceptional 11.1% |
| Immigrants | Serbia | 98.5 /100 | #55 | Exceptional 11.1% |
| Estonians | 98.2 /100 | #56 | Exceptional 11.1% |
| Scandinavians | 98.2 /100 | #57 | Exceptional 11.1% |
| Germans | 98.1 /100 | #58 | Exceptional 11.1% |
| Immigrants | Europe | 98.0 /100 | #59 | Exceptional 11.2% |
| Immigrants | Sri Lanka | 97.9 /100 | #60 | Exceptional 11.2% |
| Immigrants | Italy | 97.9 /100 | #61 | Exceptional 11.2% |
| Austrians | 97.8 /100 | #62 | Exceptional 11.2% |
| Ukrainians | 97.8 /100 | #63 | Exceptional 11.2% |
| Swiss | 97.7 /100 | #64 | Exceptional 11.2% |
| Immigrants | Asia | 97.5 /100 | #65 | Exceptional 11.2% |
| Immigrants | Netherlands | 97.5 /100 | #66 | Exceptional 11.2% |
| Immigrants | Australia | 97.4 /100 | #67 | Exceptional 11.2% |
| Slovaks | 97.4 /100 | #68 | Exceptional 11.2% |