Native/Alaskan vs Immigrants from Costa Rica Married-Couple Family Poverty
COMPARE
Native/Alaskan
Immigrants from Costa Rica
Married-Couple Family Poverty
Married-Couple Family Poverty Comparison
Natives/Alaskans
Immigrants from Costa Rica
8.2%
MARRIED-COUPLE FAMILY POVERTY
0.0/ 100
METRIC RATING
329th/ 347
METRIC RANK
5.4%
MARRIED-COUPLE FAMILY POVERTY
19.4/ 100
METRIC RATING
204th/ 347
METRIC RANK
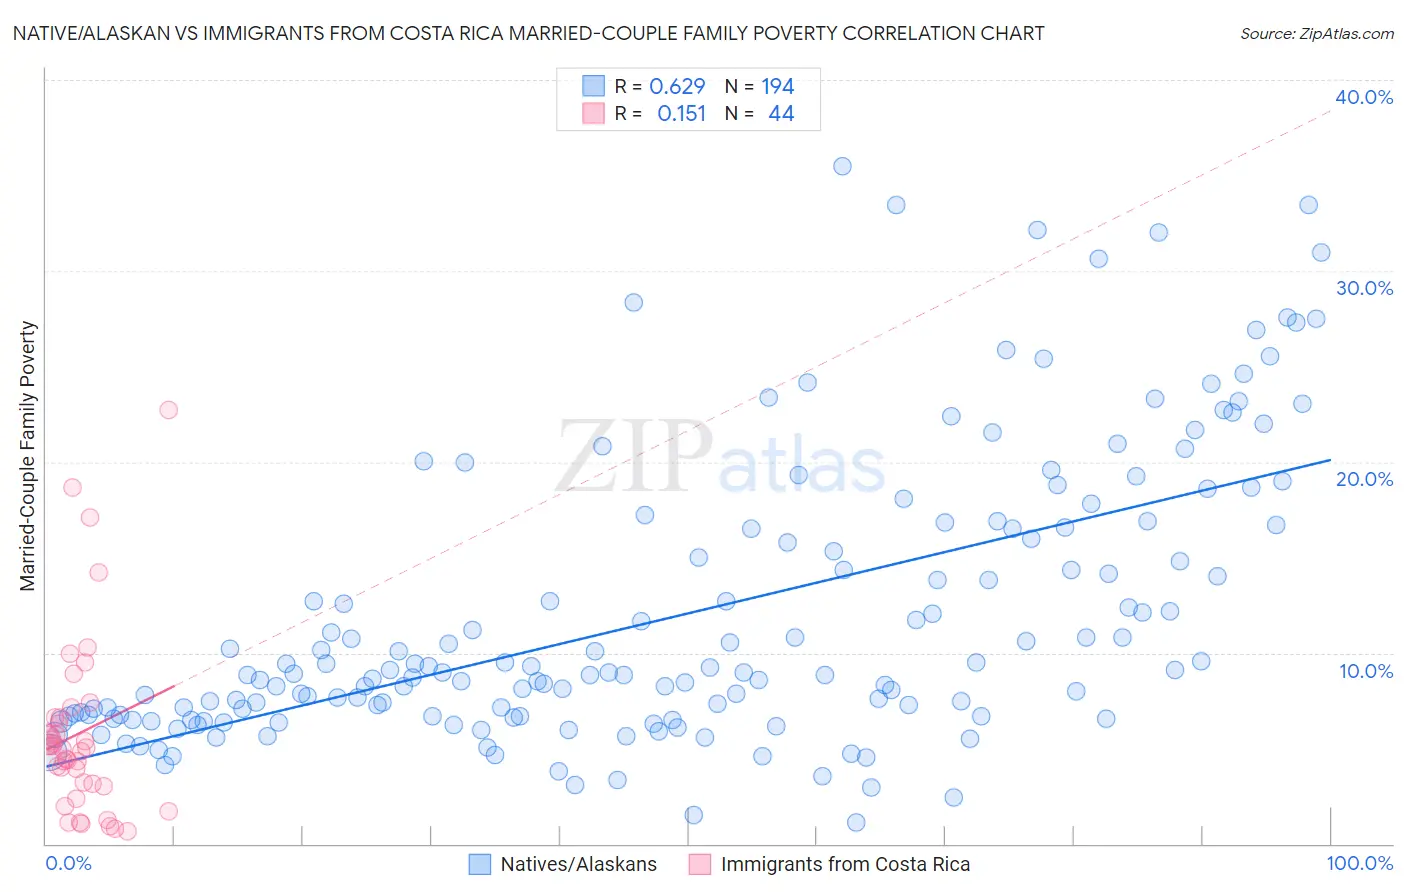
Native/Alaskan vs Immigrants from Costa Rica Married-Couple Family Poverty Correlation Chart
The statistical analysis conducted on geographies consisting of 506,148,611 people shows a significant positive correlation between the proportion of Natives/Alaskans and poverty level among married-couple families in the United States with a correlation coefficient (R) of 0.629 and weighted average of 8.2%. Similarly, the statistical analysis conducted on geographies consisting of 203,682,696 people shows a poor positive correlation between the proportion of Immigrants from Costa Rica and poverty level among married-couple families in the United States with a correlation coefficient (R) of 0.151 and weighted average of 5.4%, a difference of 50.7%.
Married-Couple Family Poverty Correlation Summary
| Measurement | Native/Alaskan | Immigrants from Costa Rica |
| Minimum | 1.1% | 0.67% |
| Maximum | 35.5% | 22.7% |
| Range | 34.4% | 22.1% |
| Mean | 12.0% | 5.8% |
| Median | 9.0% | 5.0% |
| Interquartile 25% (IQ1) | 6.7% | 3.1% |
| Interquartile 75% (IQ3) | 16.5% | 6.6% |
| Interquartile Range (IQR) | 9.9% | 3.5% |
| Standard Deviation (Sample) | 7.4% | 4.7% |
| Standard Deviation (Population) | 7.4% | 4.7% |
Similar Demographics by Married-Couple Family Poverty
Demographics Similar to Natives/Alaskans by Married-Couple Family Poverty
In terms of married-couple family poverty, the demographic groups most similar to Natives/Alaskans are Paiute (8.3%, a difference of 1.3%), Central American Indian (8.3%, a difference of 1.3%), Dominican (8.3%, a difference of 1.4%), Lumbee (8.3%, a difference of 1.9%), and Immigrants from Dominican Republic (8.4%, a difference of 2.5%).
| Demographics | Rating | Rank | Married-Couple Family Poverty |
| Immigrants | Honduras | 0.0 /100 | #322 | Tragic 7.3% |
| Vietnamese | 0.0 /100 | #323 | Tragic 7.4% |
| Immigrants | Central America | 0.0 /100 | #324 | Tragic 7.4% |
| Immigrants | Cuba | 0.0 /100 | #325 | Tragic 7.5% |
| Immigrants | Bangladesh | 0.0 /100 | #326 | Tragic 7.5% |
| Hispanics or Latinos | 0.0 /100 | #327 | Tragic 7.5% |
| Immigrants | Mexico | 0.0 /100 | #328 | Tragic 7.6% |
| Natives/Alaskans | 0.0 /100 | #329 | Tragic 8.2% |
| Paiute | 0.0 /100 | #330 | Tragic 8.3% |
| Central American Indians | 0.0 /100 | #331 | Tragic 8.3% |
| Dominicans | 0.0 /100 | #332 | Tragic 8.3% |
| Lumbee | 0.0 /100 | #333 | Tragic 8.3% |
| Immigrants | Dominican Republic | 0.0 /100 | #334 | Tragic 8.4% |
| Sioux | 0.0 /100 | #335 | Tragic 8.7% |
| Apache | 0.0 /100 | #336 | Tragic 9.0% |
Demographics Similar to Immigrants from Costa Rica by Married-Couple Family Poverty
In terms of married-couple family poverty, the demographic groups most similar to Immigrants from Costa Rica are Chippewa (5.4%, a difference of 0.080%), Osage (5.4%, a difference of 0.19%), Immigrants from Africa (5.5%, a difference of 0.33%), Immigrants from Peru (5.4%, a difference of 0.41%), and French American Indian (5.5%, a difference of 0.64%).
| Demographics | Rating | Rank | Married-Couple Family Poverty |
| Liberians | 26.3 /100 | #197 | Fair 5.4% |
| Immigrants | Belarus | 26.2 /100 | #198 | Fair 5.4% |
| Uruguayans | 25.0 /100 | #199 | Fair 5.4% |
| Immigrants | Morocco | 24.3 /100 | #200 | Fair 5.4% |
| Lebanese | 24.1 /100 | #201 | Fair 5.4% |
| Immigrants | Middle Africa | 23.8 /100 | #202 | Fair 5.4% |
| Immigrants | Peru | 21.8 /100 | #203 | Fair 5.4% |
| Immigrants | Costa Rica | 19.4 /100 | #204 | Poor 5.4% |
| Chippewa | 18.9 /100 | #205 | Poor 5.4% |
| Osage | 18.4 /100 | #206 | Poor 5.4% |
| Immigrants | Africa | 17.6 /100 | #207 | Poor 5.5% |
| French American Indians | 16.1 /100 | #208 | Poor 5.5% |
| Immigrants | Syria | 15.4 /100 | #209 | Poor 5.5% |
| Immigrants | Micronesia | 14.4 /100 | #210 | Poor 5.5% |
| Nigerians | 14.3 /100 | #211 | Poor 5.5% |